
Our monthly report covering Wheat, Corn, Soybeans, Soy products, Palm oil, Sugar, Coffee and Dairy. The S&P GSCI Agriculture Index eased 0.6% month-to-date, led by a sharp decline in coffee prices due to increases in certified inventories.
The S&P GSCI Agriculture Index eased 0.6% month-to-date, led by a sharp decline in coffee prices due to increases in certified inventories. Meanwhile, the latest CFTC report marked the fourth consecutive speculator net sell across agricultural commodities, pushing the Managed Money position into net short territory for the first time since September 2024. In the key constituent product groups, speculators’ net short position in grains and oilseeds is widening while their net long position in soft commodities continues to narrow. On May 12, the US and China announced a three-month suspension of most of their recent bilateral tariff hikes. On the same day, the USDA’s WASDE report, which included the department’s first set of forecasts for the upcoming 2025/26 season, was released without causing much of a stir. However, forecasts for record corn and soybean yields in the US will keep the market interested should crop conditions shown signs of worsening.
Wheat

Wheat output got a bit tighter in the last month
- Small crop trimmings might take place in Australia, Argentina, and the EU in 2025/26.
- Little change is expected in world stocks next season, with gains in India set to be offset by declines elsewhere.
Corn

Lower global stocks on strong US demand
- Corn planting is almost over in the Northern Hemisphere.
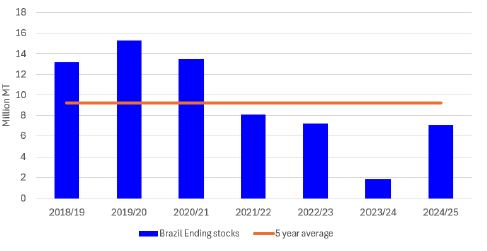
- Strong demand for US exports, combined with Brazilian ending stocks being below the five-year average, will keep CBOT prices supported.
Soybeans

Prices continue to hold up in the face of trade headwinds
- Markets reacted favourably to the news that the US and China had agreed to a three-month tariff truce.
Soy Complex

Uncertain US biofuel policies drive soy oil volatility
- The soy oil market will remain subject to the near-term development of US policies in the weeks ahead.
Palm Oil

MDE-Bursa Palm Oil will have limited downside price risks in Q2 2025
- Palm oil prices remain competitive versus soft oil prices.
- Malaysian palm oil inventories increased month-on-month in May 2025.
Sugar

Markets await clarity on Brazilian production ideas as Northern Hemisphere harvests come to a close
- Prices remain within the USc 17.00 to 18.50/lb range as estimates suggest trade surpluses in the months ahead.
Coffee

Please note that we have excluded the coffee section from this month’s edition, as we will be publishing our coffee quarterly report in the near future
Dairy

The latest Global Dairy Trade auction price decreased 0.9% to an average of USD 4,589
- The provisional EU average farmgate milk price increased 0.32% MOM in April to EUR 53.40/100kg.
- The US consumer price index for dairy and related products increased 1.6% YOY in April.
Wheat
Wheat output got a bit tighter in the last month
- An uneventful WASDE saw little market reaction.
- Small crop trimmings might take place in Australia, Argentina, and the EU in 2025/26.
- Little change is expected in world stocks next season, with gains in India set to be offset by declines elsewhere.
We remain bullish on prices throughout the year
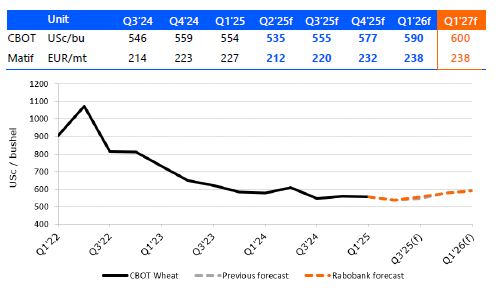
The May WASDE was relatively uneventful for wheat. Expectations for Russian output were completely uncontroversial at 83m mt, but the numbers for Argentine and Australian output look on the high side. Much of Australia has been drier than normal, and currently the crop looks like it will be under 30m mt. Of course, it is still early days, and if the rains in the forecast materialize, they will allow more area to be sown. Still, the USDA’s 31m mt looks optimistic. Meanwhile, in early May, Argentina saw an ocean land on the flatness of the Pampas: Up to 400mm of rain fell in significant parts of the wheat belt in just two days (mainly in the north of Buenos Aires Province and, luckily, not as intensely over Buenos Aires city). At best, this will delay the planting in the affected areas, but there is more rain in the forecast and draining such amounts of water may take time. A reduction in planted area is likely. So the USDA expectation for a further increase in wheat area is also looking quite optimistic here.
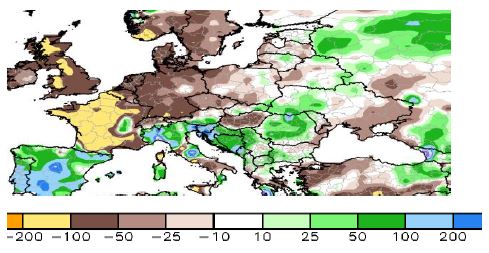
Western Europe has been dry. In the last three months to May 27, the rainfall anomaly in much of France was over 100mm, whereas in virtually all of Germany and England the rainfall deficit was between 50 to 100mm. In the one-week forecast, rainfall is expected for the UK and Germany but not for France. Luckily temperatures have not been particularly hot (at least not for now), but ongoing dryness will likely result in some trimming of expectation for EU wheat output in the coming days, preventing a large stock reflation and supporting prices.
Stocks are expected to increase in India, but not in the rest of the world combined. In the latest WASDE, global stocks in 2025/26 were virtually unchanged, and increasing by 3.5m mt outside of China. It is important to note that this includes a 4.5m mt stock build in India, given that the USDA does not expect significant exports out of the subcontinent. A big question mark is whether India could allow some exports of wheat after a record crop. Following the experience of sugar, when the country allowed a small export quota but then the sugar harvest disappointed and it was not possible to fulfill it, we believe the government will be likely be conservative. If an export quota is allowed, it will likely be a small volume that will still result in stock accumulation in India. With the crop trimmings expected in Argentina, Australia, and the EU, the global balance sheet looks a bit tighter than in the last WASDE. But if India opens the export gates or Russian output ends up being bigger than expected following mild spring weather, we could see prices capped. Similarly, the other risk to our mildly bullish forecast is if a peace deal is reached between Ukraine and Russia.
Rainfall anomaly (mm) across much of western Europe: Great for sunbathing, grim for grain
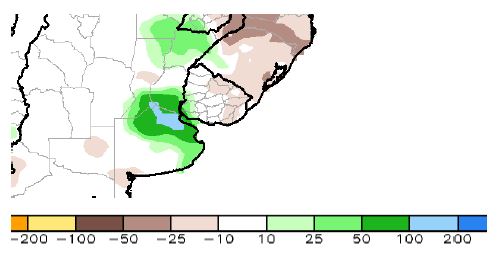
One-week rainfall anomaly (mm) to May 22: Rainfall over some of Argentina’s wheat areas to at least delay plantings
Corn
Lower global stocks on strong US demand
- Corn planting is almost over in the Northern Hemisphere.
- Strong demand for US exports, combined with Brazilian ending stocks being below the five-year average, will keep CBOT prices supported.
Strong demand for corn will lead to lower global ending stocks
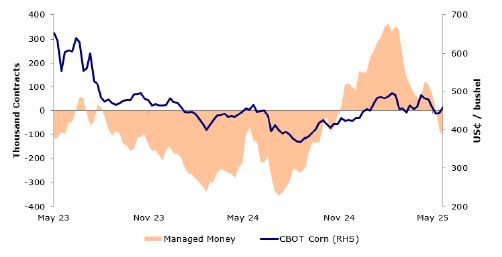
Managed Money increased their net short position from 84,000 to 103,000 lots. The bearish sentiment comes amid favorable weather and solid global production in major producing regions. At the same time, upward adjustments from CONAB to corn production estimates in South America have led to the sentiment that new-crop corn production will be plentiful. Funds have reduced their net long positions, which reached near-record levels in February. Since then, funds have steadily moved to a more bearish position due to the favorable outlook.
In the Northern Hemisphere, most of the corn has been planted (87% in the US, 95% in France, 93% in Ukraine), and the focus now turns to crop conditions. The USDA published its first look at corn conditions, with 68% rated good to excellent – below the analyst average of 73%. In France, corn conditions slipped 1% relative to last week, with the week of May 19 showing 87% good/excellent conditions, but are still 3 percentage points higher than in the same period last year. The EU’s yield estimate, published on May 26, is unchanged compared to last month but is well above last year’s estimate. Pockets of concern remain in parts of northern Europe, as there has been little rain. However, the forecast to the end of May includes some rain for northern France and Germany, while eastern Ukraine continues to see little to no rain.
In South America, Brazil’s CONAB adjusted its corn production estimate in its May report, as favorable weather and higher-than-expected planted area for safrinha second-crop corn pushes total production in 2024/25 to 126.8m mt. Improved weather in Brazil, with timely rains in most states, has increased yield estimates for both the first and second corn crops. As of May, the first corn crop in Brazil is 78% harvested, with yields better than expected in most states. The safrinha crop is now estimated at 99.8m mt, benefiting from larger-than-expected acreage. In Argentina, the Buenos Aires Grain Exchange (BAGE) left its 2024/25 production forecast unchanged at 49m mt, but recent harvest reports are showing that areas affected by leafhopper last year are now showing better-than-expected yields. Recent rains in parts of Argentina have slowed down harvest progress, which stands at 38.8% as of May 21 but remains well above the pace of last year and the five-year average.
US exports remain 28% ahead of the USDA’s 2024/25 marketing year estimate – which the USDA will likely revise up – at a time when Argentina and Brazil are starting to harvest their corn. Fresh supplies from South America should start to shift seasonal demand. FOB prices out of Argentina and Brazil for July and August deliveries are becoming appealing, potentially leading to a slowdown in US exports.
Global stocks continue to be tight, even with good weather and higher production numbers. As strong US export demand has extended longer than expected, the likelihood of the USDA having to revise up its corn export numbers will impact carryover stocks and, ultimately, global stocks. Strong domestic demand is preventing Brazil from rebuilding stocks, despite increases in production. CBOT Corn prices are likely to remain above USD 4 per bushel.
Managed Money net positions have turned negative as corn production outlook improves
Brazilian ending stocks are having difficulty reaching the five-year average
Soybeans
Prices continue to hold up in the face of trade headwinds
- Markets reacted favourably to the news that the US and China had agreed to a three-month tariff truce.
- The USDA’s first look at the US balance sheet in 2025/26 saw reduced stocks, but questions remain.
US-China trade conditions remain the critical price risk
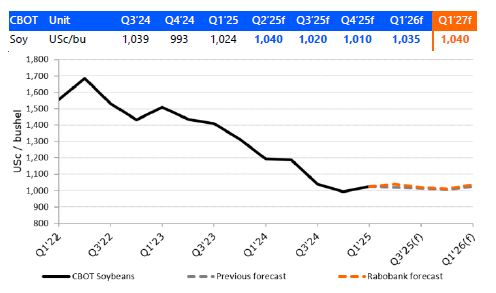
CBOT Jul 2025 Soybeans have had a muted four weeks, inching up 0.1% MOM through May 23. Contracts traded between USc 1,040 and USc 1,080/bu in the period, remaining confined within the USc 970 to USc 1,110/bu range set in Q4 2024. The CBOT Jul-Nov 2025 Soybean spread narrowed from USc 24.25 to USc 9.75/bu. This occurred in the same four-week period as the USDA’s first projection for US 2025/26 end-of-season stocks fell toward the low end of trade estimates. Furthermore, the May 12 announcement that elevated US-China tariff rates would be suspended for a three-month period also eased – perhaps prematurely – concerns in the market that the US new crop would struggle to find international demand. Having established a bearish position in futures and options contracts at the start of March, speculators returned to a net long position in the middle of April and have maintained that stance. The latest CFTC report put their position at 12,654 net lots despite a net sell of 25,753 net lots in the reporting period.
The USDA’s first crop projections for the 2025/26 season, published on May 12, showed a mixed outlook for the soybean market. Globally, ending stocks are expected to increase, but a season-on-season increase of under 1.2m mt is more favourable than earlier predictions. The outlook for global soybean trade in the coming 12 to 18 months is more dependent on the evolution of the broader international trade environment than on crop fundamentals, so the USDA’s projections must be taken with a grain of salt. However, we believe that the risks to the USDA’s forecast of 112m mt for China’s imports in 2025/26 are skewed to the downside.
Most of the excitement in the WASDE was found in the US balance sheet, which saw US stocks contracting to a three-season low of 295m bu in 2025/26. Despite the contraction in planted area telegraphed in the earlier Prospective Plantings report, the expected decline in US production was held to 26m bu (-0.6% YOY) due to the USDA’s modelling of what would be a record yield of 52.5 bu/acre. At the same time, the department’s US export forecast of 1,815m bu (-35m bu or -1.9% YOY) will be difficult to achieve if US-China tariffs to revert to their earlier, trade-halting levels after the current three-month truce expires.
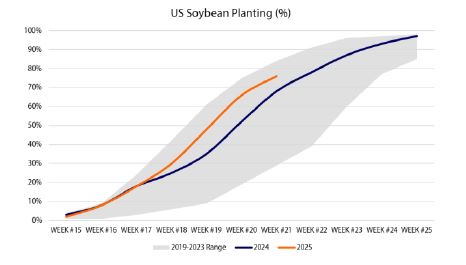
The latest Crop Progress report put the share of the US crop that has been planted at 76%, an increase of 10pp WOW and above the five-season trailing average of 68%. Meanwhile, 50% of the crop has emerged, an increase of 16 pp WOW.
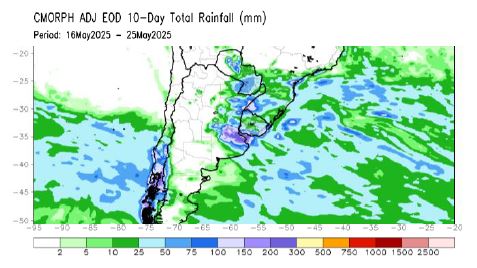
In South America, the Brazilian harvest is now all but complete (99.5% as of May 24). Meanwhile, a deluge concentrated in the north of Buenos Aires Province resulted in severe flooding, raising the prospect of significant crop losses in Argentina. Estimates from one credible source peg the loss at between 1m and 2m mt, but we caution that an accurate picture will not emerge until after the harvest is completed. The latest report from the Buenos Aires Grain Exchange indicated that harvest progress had reached 74.3% with accumulated production of 40.6m mt as of May 21. In addition to the potential outright loss of some crops, a flood-related deterioration in crop quality could see more Argentinian beans diverted to domestic crushers than would otherwise have been the case, tightening export supplies.
US planting pace remains ahead of
last season
Flooding in Argentina could see output
estimates deteriorate
Soymeal and Soy Oil
Uncertain US biofuel policies drive soy oil volatility
- The soy oil market will remain subject to the near-term development of US policies in the weeks ahead.
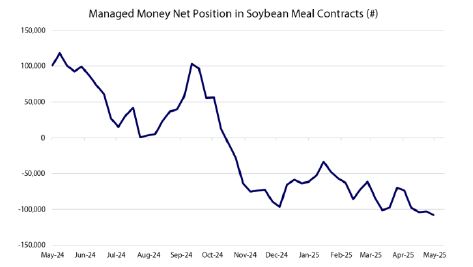
- Speculators have established a record net short position in soymeal futures and options contracts, as next-season US outstanding export sales remain sluggish.
Biofuel policies will shape soy oil price development
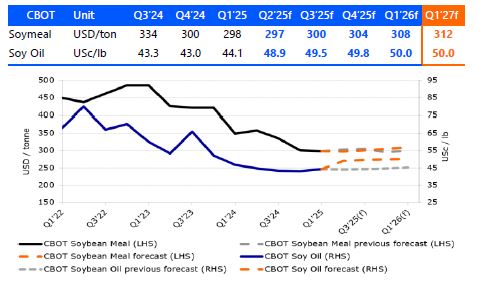
CBOT Jul 2025 Soy Oil fell 0.3% in the month-to-date up to May 27, and CBOT Jul 2025 Soymeal increased 0.7% in the same period. Soy oil, despite a muted MTD performance, exhibited pronounced volatility. The active contract recorded a period-high end-of-session price of USc 52.32/lb on May 14 before falling the exchange limit at the start of the subsequent session. US biofuel policies – or expectations about the future direction of biofuel policies – drove price volatility rather than a significant shift in fundamentals. On May 13, the US House Ways and Means Committee released its budget reconciliation markup, which included a number of modifications to the Clean Fuel Production Credit, which the market reasonably interpreted as bullish for US soy oil. In brief, the modifications would seek to 1) restrict the fuels eligible for the Section 45Z credit to those derived from feedstocks grown or produced in the US, Canada, or Mexico, 2) remove emissions arising from indirect land-use change from being considered in the calculation of fuel-specific emission rates, and 3) extend the lifetime of the credit from the end of 2027 to the end of 2031. From the perspective of North American vegetable oil biofuel feedstocks, the high-level impact of these modifications would be to limit foreign competition in the feedstock market and to reduce the gap between the emissions rates applied to vegetable oil feedstocks and animal products, such as tallow.
The US soy oil market remains susceptible to policy developments, as was evident in the subsequent market weakness, with prices unable to remain above the USc 50/lb threshold in the absence of confirmation about new policies. On May 14, US EPA Administrator Lee Zeldin announced that the confirmation of the Renewable Fuel Standard (RFS) biofuel blending mandates (the renewable volume obligations, or RVOs) for the 2026-2028 period would not be announced for several months. Later, the media reported comments from a US grain trading house, which noted that the proposed restriction of feedstocks eligible for the Section 45Z credit to those produced in North America could result in the EPA setting the biomass-based diesel mandate between 4.6bn and 4.8bn gallons. US oil and biofuel producer groups had previously called for a mandate of 5.25bn gallons. While Zeldin’s announcement merely confirmed that US biofuel policies would remain uncertain for some time, the second development was seen as bearish, prompting the sharp fall in soy oil prices and similar weakness in the RIN4 market. Given that the forces driving recent US soy oil price moves do not currently reflect actual shifts in fundamentals, price development will remain volatile in the short term. Looking ahead, the next significant milestone will be the public release of the EPA’s initial RVO proposals. These proposals, which were submitted to the White House budget office on May 14, could be released in the next two weeks.
Given events in the soy oil market, the soymeal market has taken a back seat in recent weeks. Speculator sentiment, however, has continued to turn more bearish, with Managed Money establishing a record net short in soymeal futures and options contracts. US outstanding soymeal export sales for the 2025/26 season remain well behind the pace of recent seasons (with the caveat that outstanding export sales for the season ahead tend to remain low before picking up around June). In Argentina, recent excess rainfall (see the Soybeans section) could see affected crops diverted in higher numbers to domestic crushers, increasing export supplies. Meanwhile, confirmation that the previously announced cut to export taxes would be reversed as scheduled at the end of the harvest is also expected to encourage exports in the weeks ahead.
Managed Money’s soymeal sentiment continues to sour
Palm Oil
MDE-Bursa Palm Oil will have limited downside price risks in Q2 2025
- Palm oil prices remain competitive versus soft oil prices.
- Malaysian palm oil inventories increased month-on-month in May 2025.
- Indonesia increased its crude palm oil export levy to 10% from 7.5% on May 14.
We revised down our 2025 palm oil prices forecast
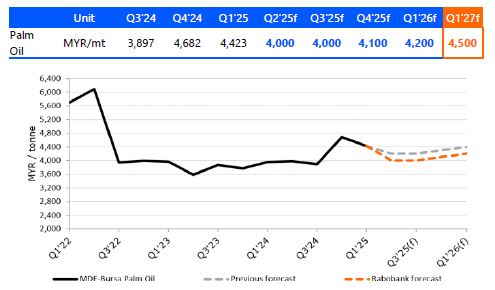
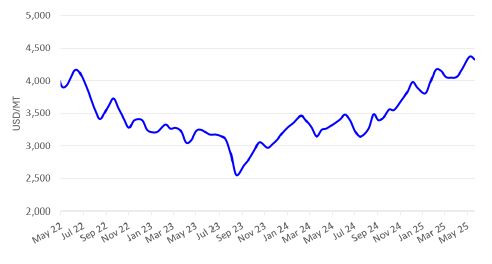
MDE-Bursa Palm Oil prices will have limited downside risks in Q2 2025. The MDE-Bursa Palm Oil active contract traded between MYR 3,700 and MYR 3,950/mt during the first three weeks of May 2025. Expectations of higher Malaysian monthly palm oil production in May, weakness in global crude oil prices, and uncertainties around US biofuel blending mandates provided bearish pressure to MDE-Bursa Palm Oil prices during this period. We expect that the active contract will trade at an average price of MYR 4,000/mt in Q2 2025. We are still expecting higher Malaysian palm oil export volumes in Q2 versus Q1. We also expect that major palm oil importers will need to restock their edible oil inventories this quarter and that palm oil prices will remain competitive versus soft oil prices in Q2.
Palm oil prices remain competitive versus soft oil prices. The spread between the CBOT Soybean Oil and MDE-Bursa Palm Oil active contracts averaged around USD 190/mt during the first three weeks of May. This is wider than the spread seen in Q1, which fluctuated between minus USD 115/mt and USD 90/mt.
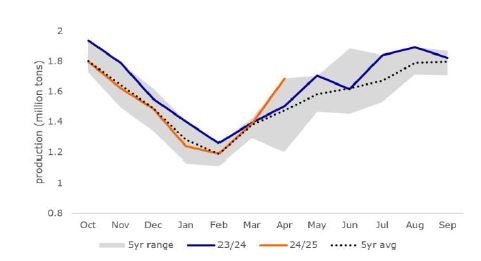
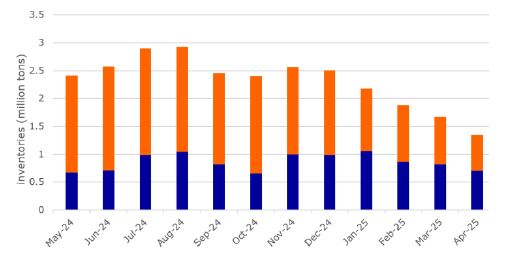
Malaysian palm oil inventories increased month-on-month in April. According to the MPOB, Malaysian palm oil exports increased by 9.6% MOM to 1.1m mt in April due to the competitiveness of palm oil prices versus global soybean oil prices. In the same month, however, Malaysian palm oil production increased by 21.5% MOM to 1.69m mt, resulting in Malaysian palm oil inventories rising by 19.3% MOM to 1.87m mt. We expect that Malaysian Q2 palm oil production will be higher than in the previous quarter. We also expect Malaysia’s palm oil exports to be higher in Q2 versus Q1, limiting the country’s accumulation of palm oil inventories in Q2.
Indonesia increased its crude palm oil export levy to 10% from 7.5% on May 14 as part of its efforts to increase funding for its biodiesel subsidy program and replanting initiatives. The export levies were also raised for RBD palm olein (from 4.5% to 7.5%) and biodiesel (from 3% to 4.75%). In the short term, the increase in palm oil export levies could negatively affect the competitiveness of Indonesian palm oil exports.
Indian monthly edible oil inventories continued to decrease in April. According to SEA India, Indian edible oil imports decreased by 11.1% MOM to 862,558mt in April. This, combined with stable domestic edible oil consumption, resulted in a further month-on-month drawdown of domestic edible oil inventories. As a result, Indian edible oil inventories (port stocks and pipelines) at the end of the month decreased by 18.9% MOM to 1.35m mt. This marked the lowest edible oil inventory since November 2020.
Malaysian monthly palm oil production will increase month-on-month in May 2025
Indian monthly edible oil inventories continued to decrease in April 2025
Sugar
Markets await clarity on Brazilian production ideas as Northern Hemisphere harvests come to a close
- Prices remain within the USc 17.00 to 18.50/lb range as estimates suggest trade surpluses in the months ahead.
- A fuller picture of Brazilian supplies is weeks away, but the true size of the crop won’t be clear until much later.
We have lowered the front end of our forecast, but remain bullish through 2025
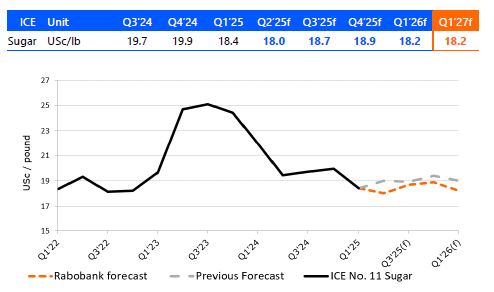
ICE Jul 2025 Sugar #11 is little changed month-to-date, trading within an end-of-session price range of USc 17.13 and USc 18.22/lb. Given the 3.5% MOM decline in the contract observed in the prior four-week period, recent price development reflects a period of greater stabilisation – rather than renewed strength – in the sugar market. Regarding global production prospects, the past month has not seen significant change in the fundamental outlook. The market remains sensitive to developments in Brazil, given Thailand’s weaker-than-expected harvest and India’s export quota, which seems unlikely to be fully met. Currently, market expectations for Indian exports are coalesced in the range of 700-800k mt, falling short of the 1.0m mt quota. However, with Brazil’s wet season having ended, market participants will now turn their focus to crop reports, with the 2025/26 season now in its initial phases, and, on the margin, be less attuned to weather conditions.
The latest UNICA report, covering the second half of April, which saw wet weather in multiple areas of the Brazilian sugar belt, included sizeable season-on-season declines for the period in terms of both the sugarcane crush volume (-49% YOY) and sugar production (-54% YOY) in Centre-South Brazil. On an accumulated basis through 2025/26 to date, the crush volume (34.3m mt) was 33% lower, and sugar production (1.58m mt) was 39% lower, in the region compared to the same period in 2024/25. The average sugar mix also exhibited a season-on-season decline of 1.7 pp. However, the season in Brazil has only just begun and it will be at least a month until we can assess production based on harvest numbers. Subsequent fine-tuning will underpin sentiment and price development.
Given the earlier extended period of below-average rainfall in Brazil and the weakness in major harvests in the Northern Hemisphere compared to previous expectations, the market may focus on indications that the Brazilian season could also underperform. Additionally, compensation in the form of an elevated sugar mix is expected to be provided to Brazilian sugar output against a projected fall in sugarcane production. This, plus the prevailing view that international trade in raw sugar will be in surplus through Q3 2025, will likely act as a headwind to prices.
Global sugar demand remains something of an enigma, but the decline in prices since March could result in strength in the short term. The tariff-related turmoil in financial markets and downturn in expectations for economic growth both pose downside risks to consumption in the months ahead. The ICE Jul-Oct 2025 Sugar #11 spread has trended lower throughout 2025 to date, a potential indication that short-term demand has been soft. According to Comex Stat, in the first four months of 2025, Brazil exported almost 7.3m mt of sugar compared to 10.7m mt in the same period in 2024. Meanwhile, the ICE Oct-Oct 2025 White Sugar premium has spent most of the past fortnight range-bound between USD 98 and USD 96/mt.
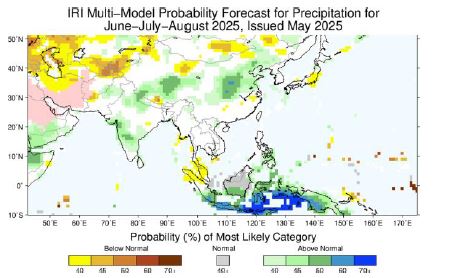
The Indian production outlook in the coming season and 2026/27 has benefitted from forecasts for above-average rainfall during the monsoon, which started more than a week ahead of schedule. This development is bearish for the market in principle, but its actual impact will be limited unless export quotas are raised, which is a decision months in the future. Meanwhile, Thailand announced that it expects that rainfall in the current wet season will amount to 5% more than average but less than the amount received in 2024.
Monsoon outlook favourable for Indian sugar production
Dairy
The latest Global Dairy Trade auction price decreased 0.9% to an average of USD 4,589 on May 20
- The provisional EU average farmgate milk price increased 0.32% MOM in April to EUR 53.40/100kg.
- The US consumer price index for dairy and related products increased 1.6% YOY in April.
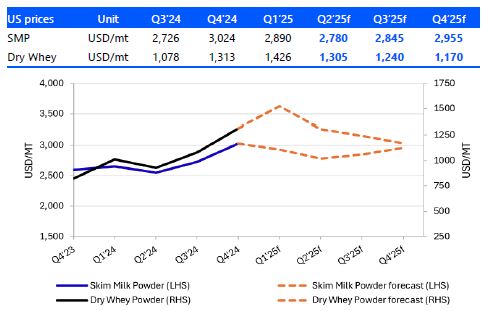
We expect both US SMP and dry whey prices to decrease in Q2
The Global Dairy Trade (GDT) price index decreased to 1,333 points from last auction’s 1,344 points, setting the index just under the highest level it has been in three years. The latest auction brought disappointment for powder prices, with whole milk powder (WMP) slipping 1% to USD 4,332 and skim milk powder (SMP) declining 0.7% to USD 2,817. Lactose saw a significant drop, almost returning to last month’s average price, as it fell 13.2% to USD 1,398. Similarly, cheddar plunged 9.2% to USD 5,007 while butter declined 1.5% to USD 7,821. Only mozzarella and anhydrous milk fat saw gains. Mozzarella increased 0.7% to USD 4,788 and anhydrous milk fat bumped up 0.9% to USD 7,273.
The USDA reported a 1.5% increase in April US milk production versus the prior year, marking the fourth-consecutive month of stronger year-on-year output. The increase in output results from an increase in milk per cow coupled with an expansion in herd size. The herd expanded to 9,425,000 head, which is 89,000 head greater than last year and an increase of 5,000 head from last month. Meanwhile, milk per cow increased by 0.5% YOY. Total milk production (which excludes milk sucked by calves), was down 0.504m pounds MOM, now at 19,370m pounds. Milk production declined in California (-1.4% YOY), Washington (-4.5%), and Oregon (-1.9%). Meanwhile, Texan milk production increased by 10.6% YOY to 1,511m pounds. South Dakota continues to see a significant increase as well, with production surging 9.2% YOY. Production in Wisconsin grew by 0.1%, Idaho by 4.2%, and New York by 1.4%, when compared to last year. We continue to maintain a positive outlook on US production, despite the rising risk of avian influenza in Idaho and the lingering effects of the disease in California.
The provisional EU average farmgate milk price increased 0.32% MOM in April, from EUR 53.23 to EUR 53.40/100kg. This increase follows last month’s decrease, putting year-on-year change at 15.86%. RaboResearch still expects that ongoing favorable fundamentals over the coming year will ensure robustness in EU farmgate prices.
The US consumer price index (CPI) for dairy and related products increased 1.6% YOY in April. Australian CPI for food and nonalcoholic beverages at the end of March increased 3.2% YOY. The Harmonised Index of Consumer Prices for food and beverages in the euro area increased 2.7% YOY in April. Chinese price inflation for dairy products in April was down 1.2% YOY, improving from the March CPI, which was down 1.7%. Dairy deflation persists in China following both demand and price weakness in the region.
WMP decreased to USD 4,332/mt, marking an end to three consecutive auction-to-auction increases
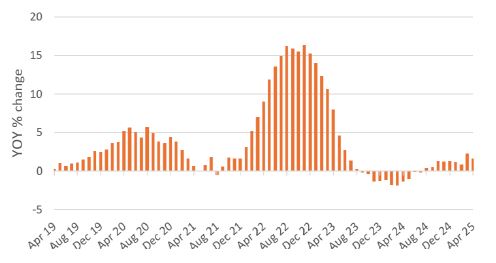
The CPI for US dairy and related products increased by 1.6% YOY in April
Agri Commodity Markets Research Analysts
Carlos Mera, Head of ACMR
carlos.mera@rabobank.com, +44 2078 094365
Charles Hart, Senior Commodity Analyst
charles.hart@rabobank.com, +44 2078 094245
Andrick Payen, RaboResearch Analyst
andrick.payen@rabobank.com, +1 (212) 8086806
Oran van Dort, Commodity Analyst
oran.van.dort@rabobank.com, +31 6 42380964
Contributing Analysts
Andy Duff – São Paulo, Brazil
andy.duff@rabobank.com
Oscar Tjakra―Singapore
oscar.tjakra@rabobank.com
Lucas Fuess – Chicago, US
lucas.fuess@rabobank.com
Corporate Risk & Treasury Management Contacts
Global Head―Martijn Sorber
+31 30 21 69447, martijn.sorber@rabobank.com
Asia―Rachel Li
+852 2103 2636, rachel.li@rabobank.com
Australia―Graydon Chong
+61 (2) 81153117, graydon.chong@rabobank.com
Europe―David Kane
+44 (20) 7664 9744, david.kane@rabobank.com
North America―Yamile Spakouris
+1 212 808 6897, yamile.spakouris@rabobank.com
Brazil ―Marcelo Ota
+55 11 969062747, marcelo.ota@rabobank.com
Disclaimer
Non Independent Research
This document is issued by Coöperatieve Rabobank U.A. incorporated in the Netherlands, trading as “Rabobank” (“Rabobank”) a cooperative with excluded liability. The liability of its members is limited. Authorised by De Nederlandsche Bank in the Netherlands and regulated by the Authoriteit Financiële Markten. Rabobank London Branch (RL) is authorised by De Nederlandsche Bank, the Netherlands and the Prudential Regulation Authority, and subject to regulation by the Financial Conduct Authority and limited regulation by the Prudential Regulation Authority. Further details are available on request. RL is registered in England and Wales under Company no. FC 11780 and under Branch No. BR002630. This document is directed exclusively to Eligible Counterparties and Professional Clients. It is not directed at Retail Clients.
This document does not purport to be impartial research and has not been prepared in accordance with legal requirements designed to promote the independence of Investment Research and is not subject to any prohibition on dealing ahead of the dissemination of Investment Research. This document does NOT purport to be an impartial assessment of the value or prospects of its subject matter and it must not be relied upon by any recipient as an impartial assessment of the value or prospects of its subject matter. No reliance may be placed by a recipient on any representations or statements made outside this document (oral or written) by any person which state or imply (or may be reasonably viewed as stating or implying) any such impartiality.
This document is for information purposes only and is not, and should not be construed as, an offer or a commitment by RL or any of its affiliates to enter into a transaction. This document does not constitute investment advice and nor is any information provided intended to offer sufficient information such that is should be relied upon for the purposes of making a decision in relation to whether to acquire any financial products. The information and opinions contained in this document have been compiled or arrived at from sources believed to be reliable, but no representation or warranty, express or implied, is made as to their accuracy, completeness or correctness.
The information contained in this document is not to be relied upon by the recipient as authoritative or taken in substitution for the exercise of judgement by any recipient. Any opinions, forecasts or estimates herein constitute a judgement of RL as at the date of this document, and there can be no assurance that future results or events will be consistent with any such opinions, forecasts or estimates. All opinions expressed in this document are subject to change without notice.
To the extent permitted by law, neither RL, nor other legal entities in the group to which it belongs accept any liability whatsoever for any direct or consequential loss howsoever arising from any use of this document or its contents or otherwise arising in connection therewith.
Insofar as permitted by applicable laws and regulations, RL or other legal entities in the group to which it belongs, their directors, officers and/or employees may have had or have a long or short position or act as a market maker and may have traded or acted as principal in the securities described within this document (or related investments) or may otherwise have conflicting interests. This may include hedging transactions carried out by RL or other legal entities in the group, and such hedging transactions may affect the value and/or liquidity of the securities described in this document. Further it may have or have had a relationship with or may provide or have provided corporate finance or other services to companies whose securities (or related investments) are described in this document. Further, internal and external publications may have been issued prior to this publication where strategies may conflict according to market conditions at the time of each publication.
This document may not be reproduced, distributed or published, in whole or in part, for any purpose, except with the prior written consent of RL. By accepting this document you agree to be bound by the foregoing restrictions. The distribution of this document in other jurisdictions may be restricted by law and recipients of this document should inform themselves about, and observe any such restrictions.
A summary of the methodology can be found on our website.
© Rabobank London, 60 London Wall, London EC2M 5AA +44(0) 207 809 3000
© 2025 – All rights reserved