Global Outlook
Contracting supplies
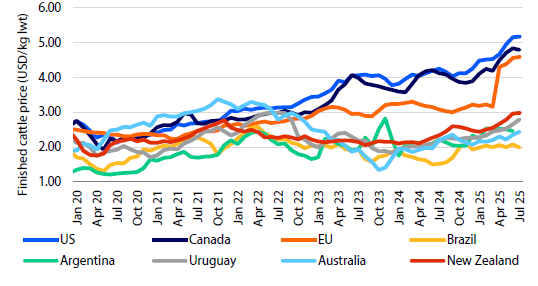
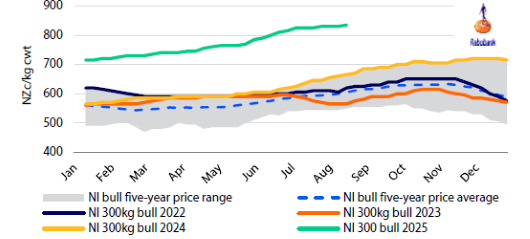
Global cattle prices continue rising
Global cattle prices have all continued their rise through Q2 (see figure 1). Northern Hemisphere countries continue to stand out at record prices, but US and Canada prices have moderated in recent weeks, suggesting some of the heat is going out of the market. Meanwhile, prices in Southern Hemisphere countries continue to increase. The reduced volumes of beef in the North American market, plus what appears to be a slight improvement in the Chinese market have generated stronger demand for Southern Hemisphere beef suppliers. This demand is now flowing through to cattle prices. In 2014 and into 2015, when the US experienced high cattle prices, New Zealand and then Australian cattle prices also started to rise. We are also seeing the Northern Hemisphere markets have a stronger influence on South American cattle prices.
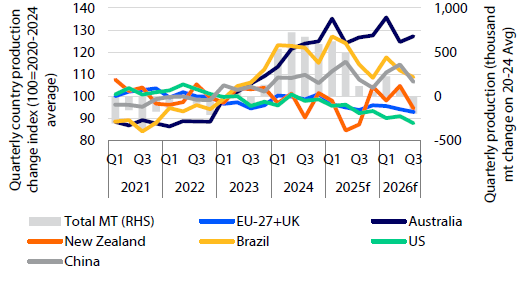
Production volumes continue contracting
Led by contractions in Europe (-5% YOY), New Zealand (-17% YOY) and the US (-5% YOY) beef production continued to decline into Q2. Total beef production declined in 1H, down 1% YOY. Australia (+11% YOY) and China (+7% YOY) saw increases in Q2 compared to Q2 2024. RaboResearch analysts believe that production in these countries is likely to continue following these trends with an overall contraction of 2% expected for 2025.
US tariffs and trade starting to impact beef trade
The latest round of tariffs included an additional 40% on the already existing 10% and 26.4% on Brazilian beef imports. Brazil had supplied a record volume of beef (336,000mt) into the US in 1H 2025. RaboResearch believes this additional tariff will have a material impact on the trade between Brazil and the US. The question remains if the volumes imported by the US in 1H have been stored and will flow into the US market over the coming months, or if there will be a shortage in the US market that in turn drives up demand from other suppliers. Furthermore, what impact does reduced exports have on the Brazil market. The analysts explore these questions in this quarter’s feature article.
Source: Macrobond, AgriHQ, China MARA, MLA, USDA, StatsNZ, RaboResearch 2025
Source: Macrobond, AgriHQ, China MARA, MLA, USDA, StatsNZ, RaboResearch 2025
Feature Article: Trade barriers and the impacts on the Brazilian beef market
Record Brazilian exports to the US in 2025
Brazilian beef exports to the US through to July 2025 were 94% higher than the same period last year (See figure 4). The one-week delay in the implementation of the tariffs – which were pushed to August 6 – supported ongoing high volumes into August as Brazilian exporters tried to beat the deadline. Even if exports drop by 50% for the remainder of the year, RaboResearch believes, based on 2024 shipment patterns from September to December, that Brazilian exports to the US could see a 15% year-over-year increase in 2025, reaching 263,000mt.
US tariffs not yet affecting Brazil’s beef trade
Nearly a month after the US began applying further import tariffs on Brazilian beef, shipments remain strong in a year-over-year comparison through to the fourth week of August 2025 (see page 7). According to processors, shipments to the US have remained relatively stable even after the tariffs have taken effect. Projections of rising live cattle prices in Brazil for 2H 2025 may explain the current appetite from American importers for Brazilian beef. RaboResearch believes the volume the US imports from Brazil may drop an estimated 10,000mt to 15,000mt per month as we progress through the remainder of the year. Coincidentally, or not, the tariffs came into effect at the end of the US domestic peak consumption period, which seasonally runs from May to August. This timing may also see reduced demand from US buyers of Brazilian exports.
Source: IBGE, Secex, Conab, RaboResearch 2025
Adjusting export volumes redirecting cuts
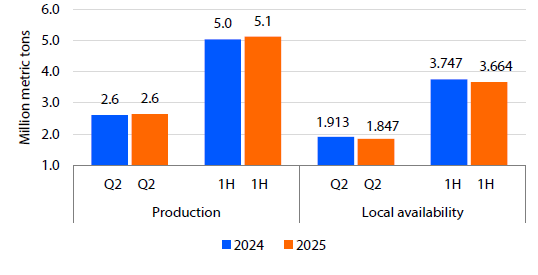
The bulk of the increased Brazilian exports to the US has come at the expense of the domestic Brazilian consumer. Domestic beef availability has dropped 2.2%, approximately 83,000mt, in the first half of 2025 (see figure 6). The main challenge with declining volumes to the US now lies in operational adjustments at processing plants. Brazilian consumers prefer hindquarter cuts, making these export markets a valuable outlet for processors. The US is Brazil’s largest buyer of trimmings, and redirecting this volume to other markets would require changes in how cuts are processed. Markets like China, the Middle East, and Egypt have historically been major importers of forequarter cuts from Brazil.
Mexico has also stood out for its significant growth in shipments over recent months – around three to four times higher than the average volume in the previous year. The market opened less than three years ago and, in July 2025, Mexico was Brazil’s third-largest beef importer with 16,000mt.
Source: IBGE, Secex, Conab, RaboResearch 2025
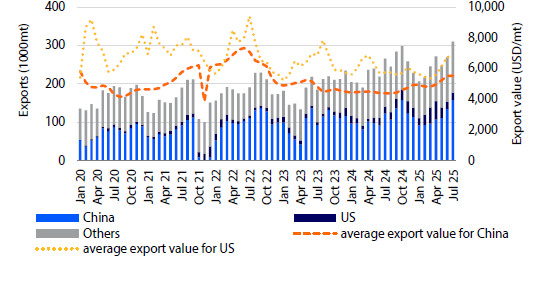
Exporters catch a break as China delays trade action
After importing the largest monthly volume of Brazilian beef ever in July 2025 – totalling 158,000mt, about 50% above this year’s monthly average – shipments still appear to have room for growth. The postponement of the announcement by Chinese authorities regarding the investigation into beef imports, originally expected on August 20 but now delayed to November 26, brought short-term relief to the industry. However, in terms of export prices, even though the futures market points to rising live cattle prices through the end of the year, the pace of appreciation for Brazilian beef in international markets is expected to be slower than in 1H 2025. RaboResearch projects a depreciation of the real in the coming months, which would offset the rise in local currency prices. In July 2025, the average export price reached USD 5,362/metric ton, 11% higher than in January 2025 and the highest level since December 2022 (see figure 3).
Source: Cepea, PTA-IBGE, Conab, RaboResearch 2025
Trade barriers or not, Brazilian beef output faces a downturn
Despite ongoing demand-side uncertainties regarding the US and China, supply-side constraints – particularly the reduced availability of slaughter-ready cattle, especially males – are already evident in the field and expected to persist through Q4 2025. Mato Grosso, Brazil’s largest cattle-producing state, recorded a historic 4.27% drop in calf production (0–12 months) in 1H 2025. The share of reproductive-age cows (over 24 months) within the female herd also fell to a record low of 61.3%, down 3.43% YOY. In the short term, international demand may encourage some producers to continue liquidating females. This strategy helps improve cash flow – especially after the prolonged decline in calf prices from 1H 2021 to 2H 2024 – and has gross margin projections ranging from 15% to 20%.
According to preliminary IBGE data, beef production rose 1% YOY in Q2 2025, slowing from 2% growth in Q1. In other words, the increases in shipments in 1H 2025 were at the expense of the 2.2% drop in domestic availability YOY (see figure 6). The reduced availability of males in feedlots is expected to intensify from Q3 onward, supporting projections of a 2% decline in beef supply in 2025, YOY.
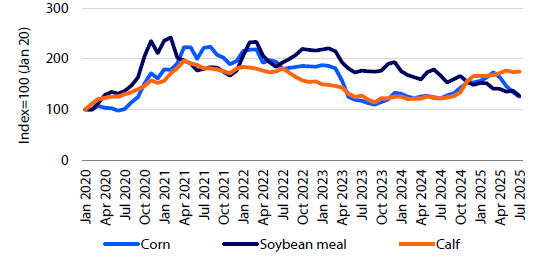
In July 2025, calf prices rose 39% YOY (see figure 5), while feed costs – the second-largest cost – dropped 14%, reaching their lowest level since June 2020. On the revenue side, live cattle prices increased 31%, with further appreciation expected through Q4. Despite this positive margin scenario, supply is still projected to remain below demand, making significant price declines for live cattle unlikely.
Source: Cepea, PTA-IBGE, Conab, RaboResearch 2025
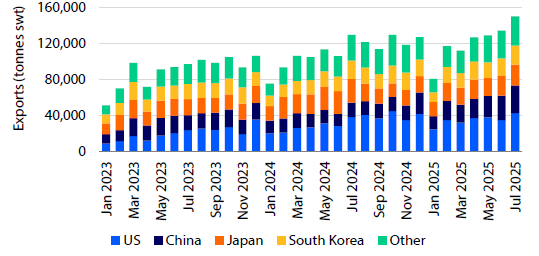
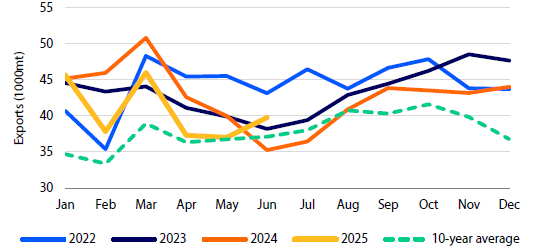
Australia – High production levels push export volumes to record levels
Stronger global markets, favorable seasonal conditions and higher cattle inventory are supporting increased production volumes. Q2 cattle slaughter numbers were up 10% YOY, and with heavier carcass weights, production volumes were up 11% YOY for the quarter, setting a new record. June was a new record volume for Australian beef exports at 134,596mt swt, but volumes in July jumped 11% to 150,435mt swt, the highest monthly volume ever recorded (see figure 8). Export volumes for the year-to-date (July) are up 17%, with volumes to the US up 23%, volumes to China up 43% and volumes to South Korea up 9%. Japan is one of the few markets with a contraction, down 14%. At such volumes, several safeguard triggers come into play. The trigger for China was reached in July and the South Korean trigger may come into play later in the year. Given current cattle inventory and seasonal conditions, we believe production volumes will continue at current levels, allowing exports to maintain their strong volumes.
US imported lean trim prices eased slightly in the second week of August down to USD 325/lb from USD 326/lb at the beginning of August. The Australian market waits to see the impact of additional tariffs on Brazil and whether that reduces Brazilian exports to the US and results in increased demand for Australian and New Zealand product.
Recovery of southern cattle producers
Southern Australian cattle producers have received some rainfall through winter, and the forecast looks positive for spring, although stock water will remain a constraint unless sufficient runoff fills dams. With a more positive outlook, producers are contemplating rebuilding stock numbers. While this will support local cattle prices as producers compete for limited stock, we believe cattle numbers across the rest of the country will mediate the effect on national cattle markets (see figure 7). Victoria is estimated to hold approximately 9% of the national beef herd, and cattle numbers in more northern states should be available to meet restocking needs.
Source: DAFF, RaboResearch 2025
Brazil – Live cattle futures signal price recovery despite external market pressures
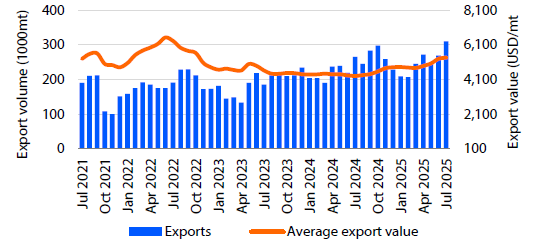
Sustained growth in Brazilian beef exports
Brazilian beef exports have maintained a strong pace through 2025, with monthly export volumes reaching record levels. July 2025 marked the highest monthly volume ever recorded, surpassing the 300,000mt threshold for the first time, a 17% YOY increase (see figure 9). Revenue growth was even more pronounced, rising 46% in the same period to a total of USD 1.7b. Total export volume for the year-to-date has reached 1.8m mt, up 13% YOY, while revenue climbed to USD 8.9bn, a 30% increase. Part of July’s surge in exports may be attributed to a possible front-loading of purchases by Chinese importers. China is conducting an investigation into beef imports – the expected announcement about this was due in August but has been postponed to November. The potential introduction of new tariffs or import quotas could be used as a commercial tool to exert downward pressure on export prices, aiming to preserve the competitiveness of Brazilian beef – especially in light of steep tariff hikes recently imposed by the US, Brazil’s second-largest beef importer. Together, China and the US account for 56% of Brazil’s total beef export volume and 59% in revenue. Partial export data through the fourth week of August indicates a strong 35% YOY increase in daily shipments and a 26% rise in average prices, resulting in a 70% surge in revenue. This strongly suggests that Chinese buyers continue to accelerate purchases ahead of the policy decision. Additionally, the one-week delay in the implementation of US tariffs – implemented on August 6 – triggered a rush among Brazilian exporters to ship beef to the US before the new duties took effect.
Source: Secex, RaboResearch 2025
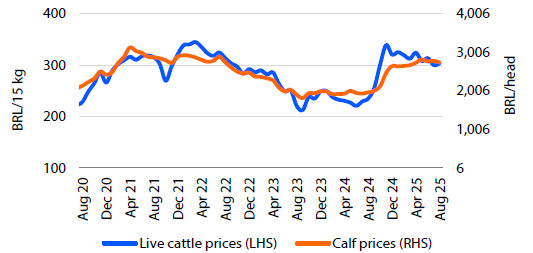
Live cattle futures point to ongoing price rebound in Q3 2025
The current volatility in the export markets, driven by uncertainties surrounding China and the US, along with the potential loss of competitiveness of beef compared to cheaper meats, has not been sufficient to exert downward pressure on live cattle prices in the futures market. This resilience is largely due to the expected decline in future feedlot supply, particularly of males, which raises price expectations. Therefore, even with a more adverse demand scenario, any further significant drops in prices remains unlikely.
Source: Cepea, RaboResearch 2025
Canada – Drought concerns persist as cattle prices build on recent record highs
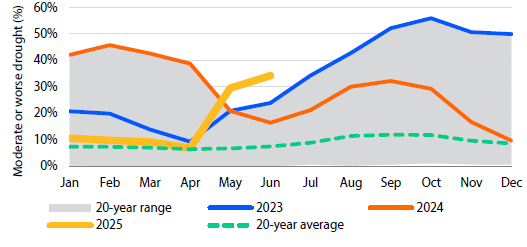
Drought keeps herd rebuilding on shaky ground
Rebuilding the herd isn’t getting any easier. In June, 34% of Canada faced moderate or worse drought conditions – the highest level since April 2024 (see Figure 11). And with conditions typically worsening through late summer and early fall, relief isn’t likely soon. As of January 1, 2025, beef replacement heifer numbers were up 1% from the previous year. Fewer heifers have entered feedyards too. From January to June, they made up 34% of placements, down from 36% last year. But with fall weaning approaching, cow-calf producers must decide whether to hold more heifers for herd replacements. Given the ongoing drought and tighter feed supplies, many may decide it’s not the right time to expand.
Source: NADM, RaboResearch 2025
Export momentum offers hope for stronger 2H 2025 volumes
Canadian beef exports surged 13% in June – the biggest year-over-year jump in global shipments since March 2024 (see figure 12). That is a bright spot after a tough stretch from June 2024 to May 2025, where volumes fell 8% compared to the previous year. Export volumes were challenged by weaker global demand and uncertainty around US trade relations. The US was the destination for 74% of Canada’s beef exports in 2024. And while more limited domestic beef supplies and rising prices will likely keep export growth modest for now, continued chaos surrounding US trade relations throughout the global market could open new doors for Canadian beef in 2H 2025 and beyond.
Source: Trade Data Monitor, RaboResearch 2025
Cattle prices break new records, retail beef prices stagnate
Cattle prices are on a tear this summer, with all classes seeing impressive gains as supplies slowly contract. In the past month, fed steer prices passed CAD 300/cwt. 850lb steers exceeded CAD 500/cwt and 550lb steers are approaching CAD 600/cwt. Seasonally, market prices should be steady to weaker in Q3, but calf and feeder cattle markets are defying expectations and pushing even higher. Stronger US cattle prices are also helping the recent momentum. Keep an eye on retail beef prices in 2H 2025. Since a March peak at CAD 25.85/kg, values have stagnated between CAD 24/kg and CAD 25/kg. It could be a sign of softer consumer demand.
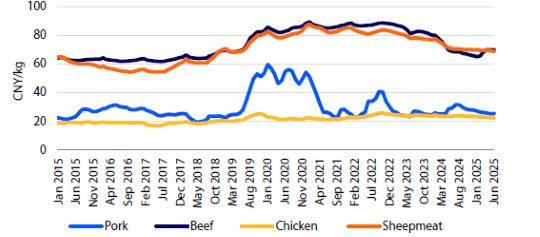
China – Beef Prices Rebound Slowly
Beef prices rise slowly
Since hitting a low in March 2025, beef prices have been gradually recovering. The live cattle price rose by 9% in Q2, back to the level seen during the same period last year. Beef retail prices also climbed to CNY 70/kg in July from CNY 65/kg in February – a 7% rise – making beef the only meat to experience rising retail prices (see figure 13). Farmer profit margins have improved greatly, thanks to lower feed costs. Profit margins moved from a loss of over CNY 1000/head in Q1 to a profit of over CNY 900/head in July. The liquidation of both beef and dairy cows in the previous months, driven by financial losses, resulted in a cattle herd decline of 2.1% YOY by the end of Q2. The total herd fell below 100m head, the lowest point for Q2 in the past three years. The liquidation led to a 2.9% rise YOY in beef slaughter numbers in 1H, and a 4.5% rise in beef production, reflecting meat yield improvement. We maintain the view that slaughter numbers will decline in 2H compared to 2024, due to the smaller number of beef cattle available for slaughter. RaboResearch believes this will lead to a marginal increase in production for 2025, and prices to continue rising, though at a modest pace as demand remains stagnant.
Source: MARA, RaboResearch 2025
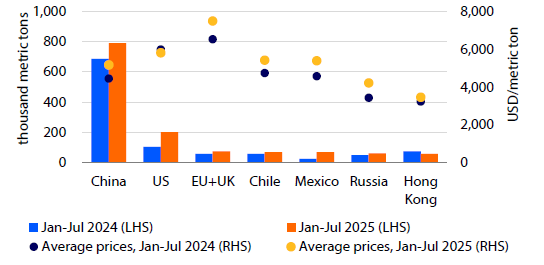
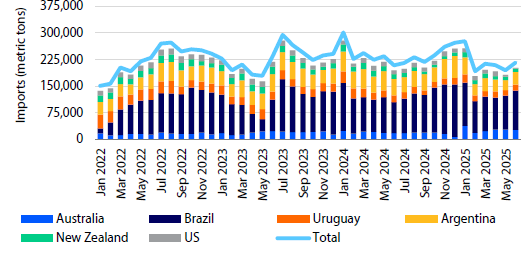
Recovery in beef imports
Beef imports showed signs of recovery in Q2, though the total volume in 1H was still down 9% YOY (see figure 14). Shipments from Australia increased 35%, while volumes from Brazil remained steady. Most other suppliers experienced decline, with New Zealand and Argentina dropping the most. Although the US and China extended the tariff truce by another 90 days until November 10, China has yet to reinstate the registration for the US beef-exporting plants. Beef imports from the US declined by 25% YOY in 1H, though the US remains the sixth-largest supplier to China. Separately, China extended its investigation into imported beef by three months, with a new date set for November 26, 2025. Assuming current conditions persist through November, we anticipate Chinese imports will rebound further in 2H, though total imports for 2025 would likely remain below 2024 levels.
Source: China Customs, RaboResearch, 2025
Europe – Supply remains limited, while demand softens in some parts of Europe
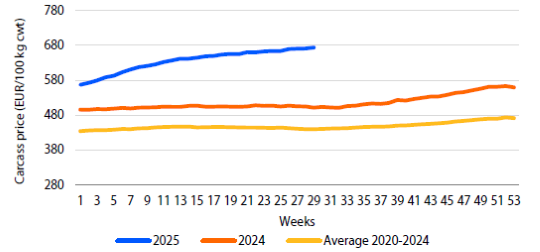
Beef market remains tight
The supply of cattle continues to be limited, with EU27+UK beef production down 3.7% YTD in the first five months of 2025. The largest YTD declines in production were recorded in the Netherlands (-13%), Belgium (-7%), Germany (-7%), Spain (-5%), France (-4%), UK (-3%), and Ireland (-0.6%), while Poland increased production (+3%). High prices have motivated farmers to pull cattle forward for slaughter at a younger age and lower weight. This might ease scarcity of supply in the short run but will result in lower slaughter in the following months. The EU average carcass price continued to climb higher, up 34% YOY in week 30 2025 (see figure 16). Cow prices eased slightly on seasonally lower demand in Northwestern Europe, but supply is expected to remain limited in Q3 2025.
Source: FAO Empres-i, RaboResearch 2025
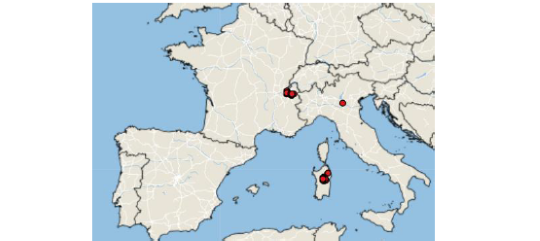
Disease situation is mixed in Europe, with limited trade impact
Ongoing bluetongue outbreaks remain an issue in the UK, affecting dairy and beef production. However, the situation is more favourable in the EU27, with a limited number of outbreaks in the period between January and August 2025.
In June 2025, lumpy skin disease made its first ever occurrence in Italy and France. In Italy, 40 cases have been recorded at the time of writing, most cases are concentrated on the island of Sardinia (see figure 15). In France, outbreaks occurred (51 to date) in the south, close to the Swiss border. As a precautionary measure, Switzerland had commenced vaccination against the virus. A number of countries outside EU, including the UK, Australia, and Canada, introduced import restrictions to certain bovine products, such as live animals, raw milk, and hides.
EU27+UK imports showed softening in May 2025, with a MOM decline of 11%. However, YTD volumes were up by 9%. Exports, on the other hand, were up 2% MOM in May 2025, but the decline for the YTD was material (-12%) as supply remains a limitation.
Source: European Commission, RaboResearch 2025
Japan – Domestic production to fall from the second half of this year, while import volume likely to fall in soft market
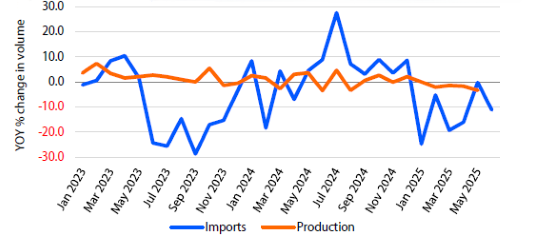
Q2 import volume decreased YOY
Domestic beef production had increased slightly through 2024, but has started to decline in 2025, falling 3.4% YOY in May (see figure 17). Similarly, import volumes increased YOY in 2024 for the first time since 2019, but have been declining YOY since January 2025, falling 13.0% in Q2. Import volumes from the US had remained almost flat YOY since September 2024 but started to decline in 2025, with a 2.4% YOY decrease in May. Imports from Australia had been increasing YOY since October 2023 but turned to a YOY decrease in 2025.
Source: ALIC, Nochuri, RaboResearch 2025
Prolonged sluggish household demand and signs of weakness in foodservice industry
Household beef consumption per capita in May 2025 was down 6.4% YOY, continuing a prolonged slump in household demand. Compared to the five-year average, household consumption has seen a substantial drop of 21.0%. Sales of yakiniku(Japanese BBQ) restaurants had been above pre-Covid levels but turned to a 0.4% YOY decline in June 2025. There is a strong tendency to curb spending on dining out due to rising living costs amid inflation. Since the beginning of 2025, a decrease in customers in these restaurants has been observed, indicating a pause in the previous upward trend. The estimated marketing quantity (consumption) of imported beef has continued to decline YOY, with a 0.15% fall in June 2025, showing no signs of bottoming out (see figure 18).
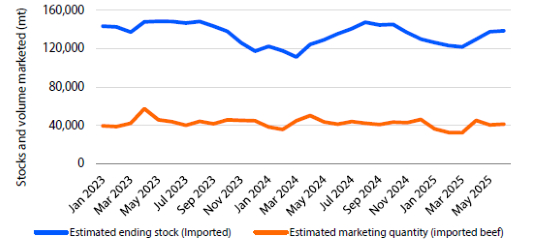
2025 consumption expected to reach historical low
Estimated ending stocks of imported beef had turned to a YOY decline in September 2023, but they started increasing in September 2024, and were up 4.3% in May 2025. While domestic production is declining, there are no signs of recovery in consumption and there is a high likelihood that the shrink in imports will continue. Additionally, if the pace of decline in the estimated marketing quantity in 1H 2025 continues throughout the year, it is expected to fall below 800,000mt in 2025, which would result in the lowest level of consumption since 1991.
Source: ALIC, Nochuri, RaboResearch 2025
Mexico – Efforts continue to eradicate the New World Screwworm
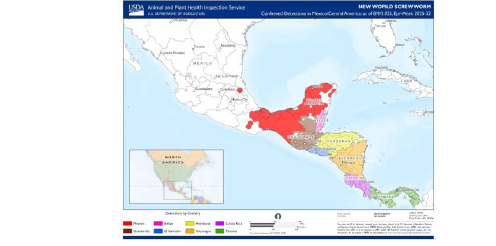
Mexican cattle exports to the US remain on hold
Mexican cattle exports to the US remain suspended due to the ongoing presence of New World Screwworm. The infestation, concentrated primarily in the southern regions such as Chiapas, Tabasco, and Campeche, has prompted a series of containment protocols and movement restrictions aimed at halting the pest’s spread (see figure 19). Currently, Mexican authorities, the domestic cattle industry, and US officials are working collaboratively on eradication strategies. Until the outbreak is fully controlled and it is pushed further south, RaboResearch believes Mexican live cattle exports to the US will remain on hold.
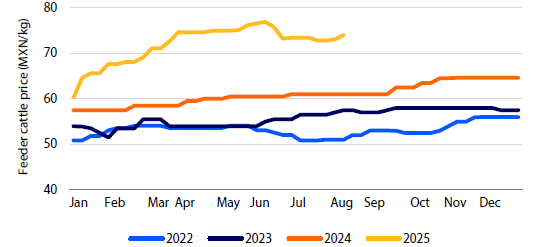
Within Mexico, internal cattle movement has been restricted, creating logistical challenges for regions that rely on incoming livestock. These disruptions have exacerbated cattle scarcity in key production zones, lifting prices. Domestic cattle prices reached record highs in May, driven by limited supply and strong domestic demand. Although prices have eased slightly in recent weeks, they are only 3% below their peak, reflecting continued market shortages.
Source: APHIS, USDA 2025
Mexico is diversifying its exports
Despite supply constraints, Mexico’s beef exports have increased slightly. In 1H 2025, beef exports volumes rose 2% compared to the same period last year. Shipments to the US grew by 3.9%. Mexico also increased exports to South Korea, Hong Kong, and Canada – part of a broader effort to diversify export destinations amid shifting global demand. Exports to Japan declined significantly. On the import side, Mexico has adjusted its sourcing strategy in response to domestic supply challenges. Beef imports from the US declined by 13.6% during 1H 2025. In contrast, imports from Brazil surged dramatically, rising from 14,000mt in the first half of 2024 to 45,000mt in the same period this year – only 20,000mt below US imports. This shift underscores Brazil’s growing role in the Mexican market.
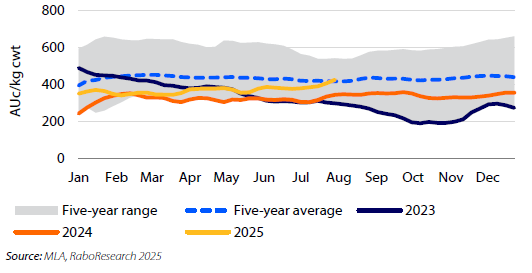
Prices have softened but remain well supported
Domestic beef prices softened in early August, largely due to seasonal factors associated with summer vacation. In early August prices were down 10% from the record highs observed in May (see figure 20). Nevertheless, they remain approximately 20% above levels recorded during the same period in 2024, indicating persistent price pressure.
Source: GCMA, RaboResearch 2025
New Zealand – Beef production volumes down in Q2 2025, while average export value hits new records
Production pulls back in Q2 after steady start to 2025
After a stable start to the year, New Zealand’s beef production saw a notable contraction in Q2 2025. Total production volume dropped 16.6% YOY to 177,000mt, following what was a steady Q1 performance. This decline aligns with expectations, given the limited cattle availability across the country. According to NZ Meat Board data, national cattle slaughter fell 15% in headcount YOY, totalling just over 700,000 head compared to more than 840,000 head in Q2 2024. The breakdown reveals a 14% drop in bull beef, a 15% decline in cull cow numbers, and a significant 20% reduction in steer slaughter.
Looking ahead, Q3 production is forecast to reach just under 118,000mt, representing a further ~5% decline. RaboResearch maintains its full-year outlook of a 4% to 5% YOY drop in total beef slaughter numbers. Year-to-date, national slaughter numbers are down 6.2%. Final production volumes will hinge on pasture conditions through spring and average carcass weights during the lower-volume Q3 period. Additionally, NZ is expected to process fewer bobby calves this year, which will increase beef production in two years time.
Source: AgriHQ, RaboResearch 2025
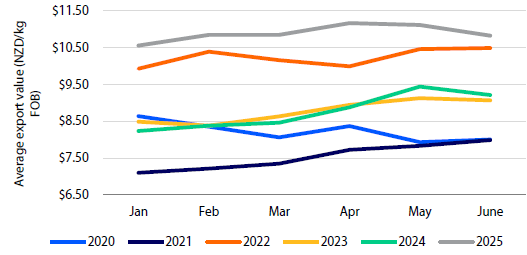
Export value climbs despite volume dip, again
In line with reduced production, New Zealand’s total beef export volume fell 11% YOY in Q2 2025, to 129,670 metric tons. Despite this decline, export value surged 7% to NZD 1.432bn, driven by strong global demand and firmer pricing. A new record average export value of NZD 11.17/kg FOB was hit in April 2025 (see figure 22). The US remained NZ’s leading market, absorbing 40% of total volume, while China accounted for 24%. Notably, Canada saw a sharp 54% Q2 YOY increase in volume to 11,345 metric tons. While still a smaller destination, this jump reflects the demand for lean trim in this market as well.
Early August saw the announcement of a 15% tariff on NZ beef entering the US. This poses a competitive challenge, especially as Australian beef continues to face only a 10% tariff. Nonetheless, strong US demand for NZ lean trimmings supports a positive outlook for farmgate prices in 2H 2025.
Source: StatsNZ, RaboResearch 2025
US – Slaughter declines accelerate, beef imports surge and margins are extreme
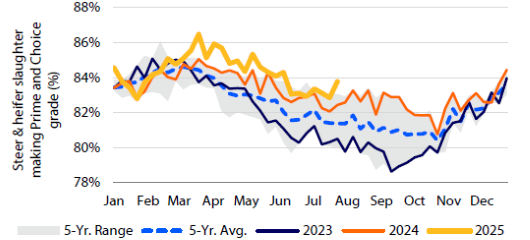
Cattle slaughter falls, but Prime and Choice beef remains ample
Cattle slaughter is on track to drop 2m head in 2025 – a 6% decline from last year and the steepest year-over-year drop since 2014. But better carcass quality and relatively slow heifer retention is limiting shortfalls for the highest quality of US beef production. From January to July, a record 84.3% of steer and heifer carcasses graded USDA Prime or Choice (see figure 23). Fed cattle carcass weights are also up by 25 lbs., as feedyards extend days on feed. The result is Prime and Choice beef production holding steady, even as total beef output slips 2% from last year during the first seven months of 2025.
Source: USDA, RaboResearch 2025
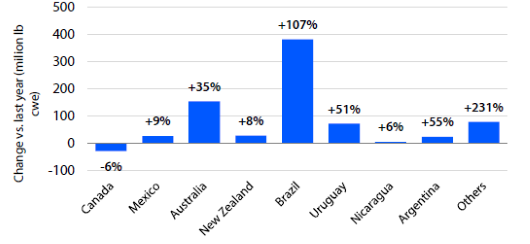
Imports surge, exports remain sluggish
First half 2025 beef imports increased 25% from last year (see figure 24). Brazil led all countries with 336,000mt (up 107%), followed by Australia at 272,000mt (up 35%) and Uruguay at 97,000mt (up 51%). Even a tariff increase to 76.4% for Brazil beef exporters in August should not stop 2025 total imports from setting a record high near 2.5m mt. On the flip side, exports remain in a downtrend. Most major markets are softer, with South Korea the lone bright spot – up 8% to 156,000mt. in 1H 2025. China remains the biggest drag on global sales. Without registration renewals for major US exporters, China shipments from January to June are down 40% year-over-year. Overall, US beef exports are on pace to fall 10% in 2025.
Source: USDA, RaboResearch 2025
Margins split: Producers thrive, processors struggle
Cash-to-cash margins are running scorching hot or ice cold depending on where you sit in the beef sector. Cow-calf producers are set to top last year’s record profits of USD 600 per head as the fall calf run kicks off in a few weeks. Feedyards are also cashing in, with annual returns on pace to break USD 400 per head in 2025 – well-above the previous record annual returns around USD 300 in 2014. Meanwhile, processors are feeling the squeeze. With cattle prices trading at new highs and wholesale beef values softening, their margins have plunged. Weekly gross margins for steer and heifer processors are now at their lowest since April 2012.
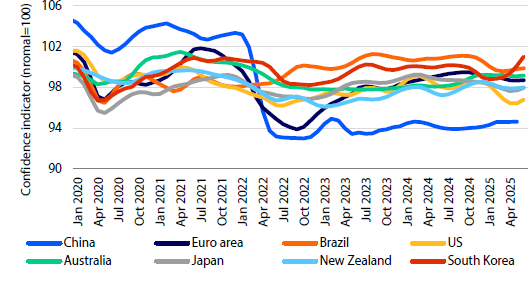
Global Outlook: Macroeconomic Dashboard
Source: OECD MEI, Consumer Opinion Surveys, Confidence Indicators, Composite Indicators, OECD Indicator, Normal=100, SA, Index, Drewry, Freightos, RaboResearch 2022
Source: OECD MEI, Consumer Opinion Surveys, Confidence Indicators, Composite Indicators, OECD Indicator, Normal=100, SA, Index, Drewry, Freightos, RaboResearch 2022
Source: OECD MEI, Consumer Opinion Surveys, Confidence Indicators, Composite Indicators, OECD Indicator, Normal=100, SA, Index, Drewry, Freightos, RaboResearch 2022
Source: OECD MEI, Consumer Opinion Surveys, Confidence Indicators, Composite Indicators, OECD Indicator, Normal=100, SA, Index, Drewry, Freightos, RaboResearch 2022
Authors
Lead author:
Angus Gidley-Baird – Australia
angus.gidley-baird@rabobank.com
Global strategist:
Éva Gocsik
eva.gocsik@rabobank.com
Contributing Authors
Chenjun Pan – China chenjun.pan@rabobank.com
Jen Corkran – New Zealand jen.corkran@rabobank.com
Lance Zimmerman – North America lance.zimmerman@raboag.com
Wagner Yanaguizawa – Brazil wagner.yanaguizawa@rabobank.com
Pablo Sherwell – Mexico pablo.sherwell@rabobank.com
Kousei Hasagawa – Japan hasagawa@nochuri.co.jp
Mr Hasegawa is an Analyst at the Norinchukin Research Institute, a part of Norinchukin Bank, Japan. He and Mr Hideki Obata have contributed to this quarterly under the terms of the partnership agreement between Rabobank and Norinchukin Bank
Other Global Animal Protein Sector Team Members:
Charlotte Talbott – North America
Charlotte.Talbott@rabobank.com
Christine McCracken – North America
christine.mccracken@rabobank.com
Gorjan Nikolik –Europe
gorjan.nikolik@rabobank.com
Nan-Dirk Mulder –Europe
nan-dirk.mulder@rabobank.com
Novel Sharma–Europe
novel.sharma@rabobank.com
Disclaimer
This publication is issued by Coöperatieve Rabobank U.A., registered in Amsterdam, The Netherlands, and/or any one or more of its affiliates and related bodies corporate (jointly and individually: “Rabobank”). Coöperatieve Rabobank U.A. is authorised and regulated by De Nederlandsche Bank and the Netherlands Authority for the Financial Markets. Rabobank London Branch is authorised by the Prudential Regulation Authority (“PRA”) and subject to regulation by the Financial Conduct Authority and limited regulation by the PRA. Details about the extent of our regulation by the PRA are available from us on request. Registered in England and Wales No. BR002630. An overview of all locations from where Rabobank issues research publications and the (other) relevant local regulators can be found here: https://www.rabobank.com/knowledge/raboresearch-locations
The information and opinions contained in this document are indicative and for discussion purposes only. No rights may be derived from any transactions described and/or commercial ideas contained in this document. This document is for information purposes only and is not, and should not be construed as, an offer, invitation or recommendation. This document shall not form the basis of, or cannot be relied upon in connection with, any contract or commitment by Rabobank to enter into any agreement or transaction. The contents of this publication are general in nature and do not take into account your personal objectives, financial situation or needs. The information in this document is not intended, and should not be understood, as an advice (including, without limitation, an advice within the meaning of article 1:1 and article 4:23 of the Dutch Financial Supervision Act). You should consider the appropriateness of the information and statements having regard to your specific circumstances and obtain financial, legal and/or tax advice as appropriate. This document is based on public information. The information and opinions contained in this document have been compiled or arrived at from sources believed to be reliable, but no representation or warranty, express or implied, is made as to their accuracy, completeness or correctness.
The information and statements herein are made in good faith and are only valid as at the date of publication of this document or marketing communication. Any opinions, forecasts or estimates herein constitute a judgement of Rabobank as at the date of this document, and there can be no assurance that future results or events will be consistent with any such opinions, forecasts or estimates. All opinions expressed in this document are subject to change without notice. To the extent permitted by law Rabobank does not accept any liability whatsoever for any loss or damage howsoever arising from any use of this document or its contents or otherwise arising in connection therewith.
This document may not be reproduced, distributed or published, in whole or in part, for any purpose, except with the prior written consent of Rabobank. The distribution of this document may be restricted by law in certain jurisdictions and recipients of this document should inform themselves about, and observe any such restrictions.
A summary of the methodologies used by Rabobank can be found on our website.
Coöperatieve Rabobank U.A., Croeselaan 18, 3521 CB Utrecht, The Netherlands. All rights reserved.