
U.S.
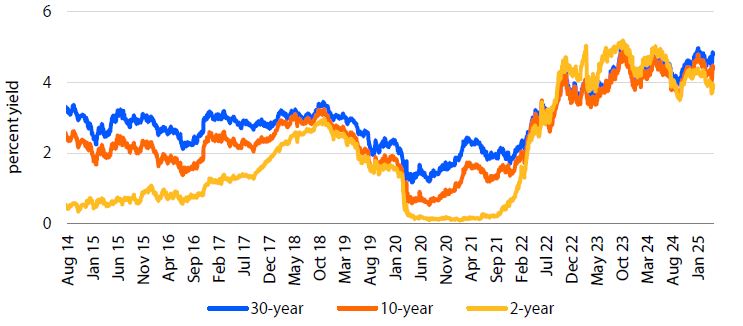
The stagflationary impact of the Trump tariffs has been in our baseline forecast since February last year. However, we assumed a more modest 5% universal tariff, rather than 10% plus country-specific additions. Based on simulations with a number of scenarios for how the trade war is going to develop, we now think that the probability of a US recession is higher than 50%. At the same time, inflation is now also likely to surpass the 4.0% peak that we had in our forecasts earlier. This leaves the Fed’s dilemma essentially unchanged: Should they hike to fight inflation or cut to combat a recession? Our expectation is that this will eventually lead to a pause in the Fed’s cutting cycle. Since the Fed is still in a cutting cycle, we have pencilled in one final cut (in June) before the pause.
Mexico
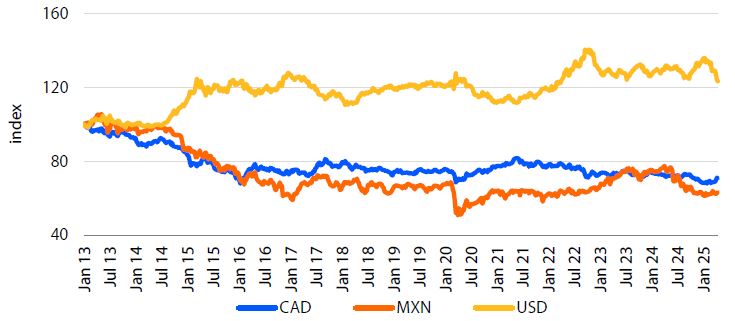
The reciprocal tariffs do not apply to Canada and Mexico at this juncture and Trump has stated that he plans to maintain the USMCA exception for now. We expect USD/MXN to trade sideways around the 21.0 level, though this will be a bumpy ride, subject to whipsaws and pullbacks as MXN remains sensitive to headlines from the White House. If Trump decides that he does, in fact, want to enforce 25% sweeping tariffs on Mexican goods, we still see USD/MXN climbing to 23.0, but as with Canada, this is not our base case. And in the unlikely event that Trump removes all tariffs against Mexico, USD/MXN could fall back to the low 19s, but yet again, this is not our base case either.
Canada
We have lowered our target for USD/CAD to 1.46 on the basis of improving negotiations and the rising likelihood of a Carney victory resulting in a further improvement of US-Canada relations after the April 28 election. Should negotiations go awry and Trump ultimately holds true to his campaign promise of a 25% sweeping tariff on Canadian goods, we could still see USD/CAD fly above and beyond 1.53, but this is not our base case. In the unlikely case that Trump removes all tariffs against Canadian imports, USD/CAD may fall back down to 1.41, but again, this is not our base case.
Interest rates, August 2014 – April 2025
Currency indices, Jan 2013 – April 2025
Climate: Elusive moisture may ruin the planting party
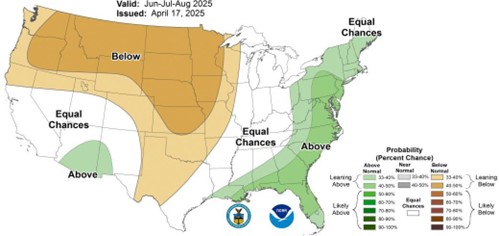
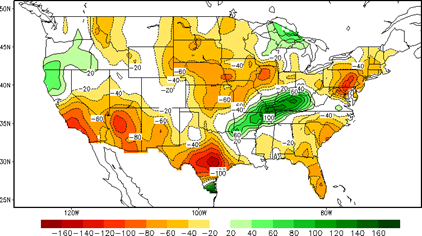
The La Niña pattern that emerged unexpectedly in late 2024 is now transitioning to ENSO- neutral conditions, with NOAA indicating a greater than 50% chance of ENSO-neutral continuing through August-October 2025. Though La Niña’s disruptive direct influence is waning, risk for extreme conditions persist. The longer-term seasonal outlook (May-July) suggests below-normal precipitation across much of the northern and central Plains into the Rockies, with above-normal precipitation favored for the eastern US and parts of the Southwest. Continued dryness in the Central and Western Corn Belt remains concerning, as current conditions persisting would challenge achieving trendline yields this year without timely rain.
In the near term, for field operations planning, be aware that a temperature pattern shift is developing. After an initially warm outlook for the Plains and Midwest, colder conditions could likely move southward from the northern US during the latter half of April. The forecast increased precipitation across the US Corn Belt and Southern Plains will benefit moisture-starved winter wheat and build soil reserves ahead of the growing season. While the more active weather pattern will include threats of severe weather, the moisture will be well- received for winter wheat development.
Winter wheat conditions continue to deteriorate across key growing regions as dryness persists, with the crop now rated 47% good to excellent, down 1 percentage point from last week and 8 points below last year. The recent dry weather has elevated drought risks, particularly in the Plains states, where Nebraska is reporting 34% of its winter wheat in very poor to poor condition, while South Dakota has 28% rated similarly. The anticipated increased precipitation in the near term will be critical for these struggling wheat areas as they emerge from dormancy.
Corn planting has begun cautiously, with 4% of the national crop in the ground as of April 13, running 2 percentage points behind last year and 1 point behind the five-year average. Texas leads with 63% of its corn planted, while early planting in other key states has been minimal. Soybean planting is also proceeding slowly at 2% complete nationally. The expected wetter pattern in the coming weeks will deliver much-needed moisture to drought-affected regions but may impact early planting progress across portions of the Corn Belt.
Seasonal precipitation outlook: Lower than usual precipitation anticipated across the West
Soil moisture anomaly (mm) for April 16, 2025: Persistent dryness into planting
Logistics: What is global trade?
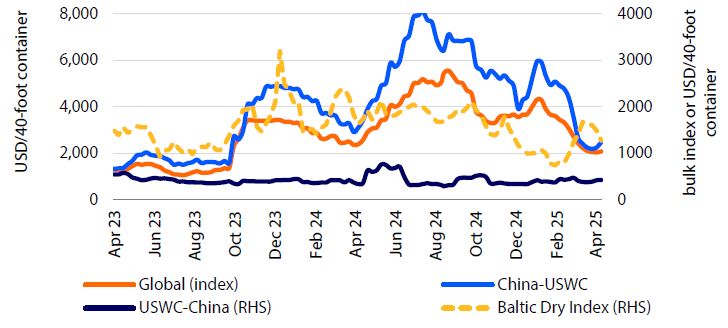
Given the geopolitical volatility and fast-changing policies on tariffs, global trade as we know it may no longer exist. Front-loading of goods, especially out of China, temporarily drove up global ocean shipping prices before it dropped back to USD 2000/FEU levels. According to a White House announcement on April 15, China now faces US tariffs of up to 245%, while tariffs for other nations pause for 90 days (with some exceptions). This has tanked demand, especially for China-US routes as shippers try to reroute through nearby countries. We expect lower volumes in global trade, impacted by the tariffs directly and weakening economic conditions indirectly.
Although low shipping volumes usually lead to lower prices, the proposed port fees on Chinese- built ships could upend this trend, targeting China’s dominance in building, operating, and route capacity in ocean shipping. This could lead to vessels skipping US port calls, especially at smaller ports, leading to disastrous impact to be felt throughout the supply chain. Think Covid again. Major ports could face huge congestion while smaller ports may be piled up with empty containers. US agricultural exporters, many of which ship out from smaller US ports, should consider contingency plans for rerouting their goods. However, this proposal faces a lot of resistance from the industry, and many doubt the potential for implementation.
Reefer rates for the North America-Asia route slightly recovered in Q1 2025 compared to a year ago, at approximately USD 3,190/FEU on a blended contract and spot price basis. Reefer rates remained steady in general amid dry container rate spikes in the past year, and we expect this trend to continue. Tariff uncertainty is clouding the outlook for North American animal protein exports, which may further limit upside on reefer rates.
The Baltic Panamax index (a proxy for grain bulk freight) has had an impressive recovery from the bottom in March. However, US tariffs may negatively impact demand, thus weakens the index.
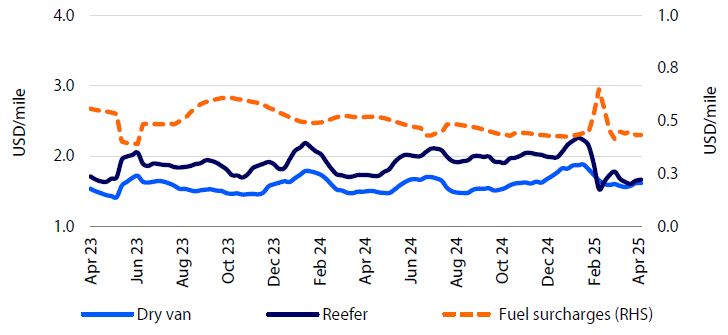
US trucking spot rates have tanked due to tariff uncertainties and the recessive outlook. Reefer truck rates were especially impacted and a surge in the fuel surcharge only temporarily supported the pricing strength. The front-loading effect has worn off and demand recovery is challenged by tariffs and the economic outlook.
Although low shipping volumes usually lead to lower prices, the proposed port fees on Chinese-built ships could upend this trend, targeting China’s dominance in building, operating, and route capacity in ocean shipping.
Select ocean freight rates,
Apr 2023-Apr 2025
US dry van and reefer truckload prices,
Apr 2023-Apr 2025
Consumer retail and foodservice: Worsening consumer sentiment jeopardizes what was expected to be a recovery year
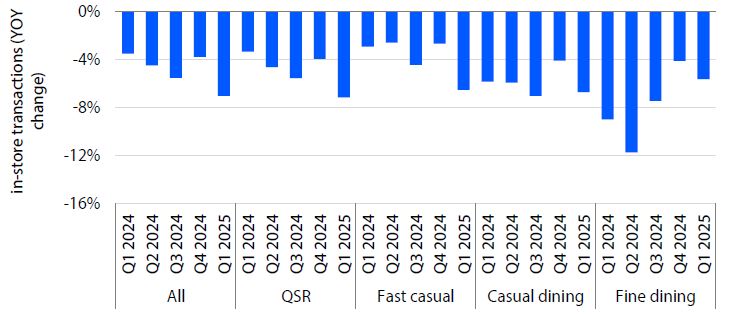
Not so Happy New Year? Contrary to usual greetings, 2025 didn’t start with much positivity for most foodservice and food retail categories. The reasons for plummeting consumer sentiment are multifaceted, including continued inflation (food inflation remains elevated), economic uncertainty (due primarily to tariffs and likely inflation), and a negative news cycle centered around shifting geo-political dynamics and US trade agreements.
Q1 2025 saw foodservice traffic decline 7% year-on-year, marking the eighth consecutive quarter of declining restaurant traffic. Furthermore, food retail hasn’t managed to capture additional spending (food retail transactions fell 5% in Q1) from reduced foodservice activity. However, some menu types are growing, for example healthy options such as salads and international cuisines such as the Mediterranean cuisine.
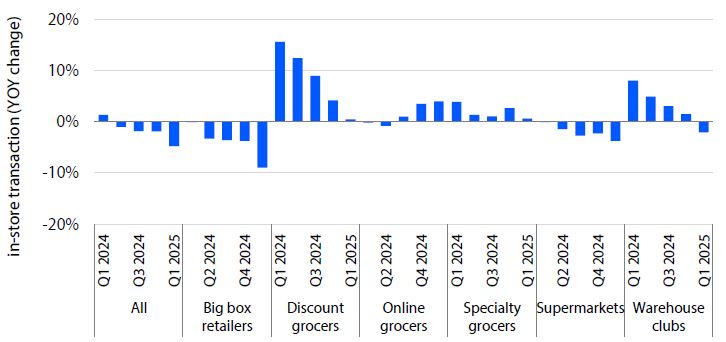
Meanwhile, in food retail, consumers are sticking more to essentials. Big box stores, known for offering non-food products (up to 50%-60% of sales), are driving the drop in traffic. Previous winners in retail, such as discounters and wholesale clubs, have seen their growth decelerate and no longer show double-digit growth as in past years.
Not all is doom and gloom, as more affluent consumers continue to prioritize food in their less strapped budgets, supporting elevated shopping experiences such as specialty and online groceries and some fine restaurant types.
Last quarter’s numbers support the polarization of consumer behaviors, led by deteriorating sentiment on the current state of the economy and persistent inflation. While there are overall retractions in both food at and away from home, pockets of growth are found at the higher end of the income spectrum.
Although this may not be entirely new, as it was already clear in previous quarters, the bottom line is that we expected 2025 to be the start of a recovery. Instead, the macro uncertainties during Q1 2025 led to the opposite: A worsening environment and a longer path to recovery.
Lastly, 2025 will clearly be volatile, but that means downs AND ups. Just as Q1 brought surprisingly steep declines, we could also see the market make quick adjustments in the event of an abrupt change such as a rapid conclusion of new trade deals for the US which are being negotiated.
The attempted Q4 2024 recovery on restaurant transactions was curbed by plummeting consumer confidence
Big box retailers drove the drop in traffic as consumers focus on essentials
Cattle: Stronger beef and cattle demand across North America provides the markets with some resiliency in early 2025
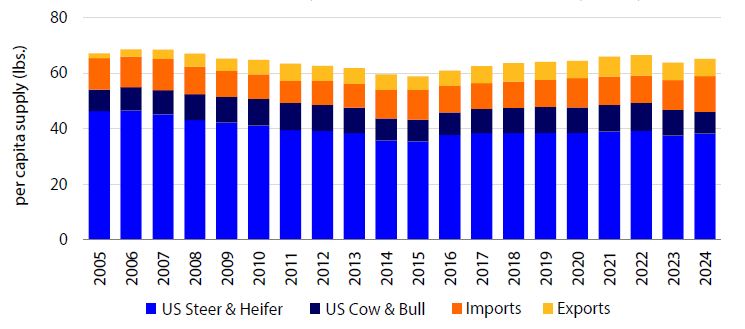
Uncertainty persists as the global markets adjust to trade news. Trade negotiations between the US and its global partners are evolving every day. Expect that to continue throughout much of 2025. Yet, for US beef markets one constant remains: US consumers largely consume domestically-sourced beef. US beef imports were record large in 2024 – surpassing 4.6b lbs. That volume only represented 18% of US beef consumption. US steer and heifer slaughter is approximately 66% of domestic consumption, while another 16% is from US cull cows and bulls. US beef exports are also a relatively small volume – representing 11% of production in 2024. Maintaining free flowing cattle and beef trade with Canada and Mexico will remain important to US capacity utilization as domestic cattle supplies decline. Collectively, the North American trade partners represent 11% of US beef consumption. Furthermore, Chinese tariff and non-tariff trade barriers complicate US beef export market access going forward, while China has been a top-three market for US beef over the last three years.
US beef demand remains exceptional ahead of the spring demand period. USDA retail beef prices posted a new all-time high in March at USD 8.42/lb. First quarter retail prices averaged 6% higher than 2024, and cutout prices were 9% higher over the same period. Per capita beef supplies were estimated to be 2% stronger for the quarter, and retail and wholesale beef demand are up 6% and 9%, respectively, compared to 2024. However, potential threats to beef demand exist. Recession risk is elevated and increased market uncertainty is dragging down consumer confidence. The good news is that labor markets remain relatively strong, and energy prices are declining. Middle meats tend to support cutout values in April and May as buyers prepare for the grilling season. Consumer concerns could weaken the market for those higher-end cuts that have been more responsible for recent year-over-year gains in cutout values.
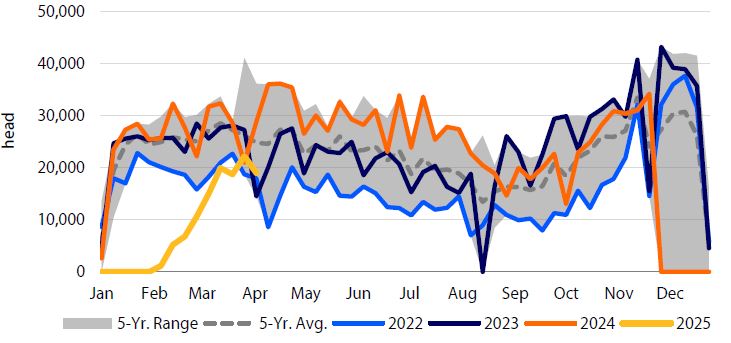
Mexico cattle imports resume after New World Screwworm. In February, Mexico feeder cattle and calf imports were allowed into the US for the first time since New World Screwworm larvae were detected in Mexico cattle in November 2024. Rabobank estimates 400,000 head of potential cattle imports remained in Mexico due to the temporary trade restriction. The domestic market handled the additional cattle supplies without major issues. Nearly all cattle weight and quality classes are trading at or near all-time price highs.
Canada cattle supplies adjust lower and prices trend higher. Aside from a brief correction as potential tariffs disrupted cattle markets in early March, Canadian cattle prices have been trading near record highs for most weight classes in 2025. Tighter cattle inventories remain price supportive in the market. On January 1, beef cow inventories were down 2%, feedyard inventories were down 4%, and total feeder cattle and calf supplies were down 2% compared to last year. Federally-inspected cattle slaughter is down 8% year-to-date compared to 2024.
Per capita US beef supplies are largely domestic, but imports matter cyclically
Mexico cattle trade to the US adjusts after New World Screwworm
Corn: Can growers capitalize on improved old-crop fundamentals?
The 2024/25 corn crop has undergone an impressive turnaround in fundamentals with each WASDE since June delivering its own morsel of good news. That said, looming trade wars, macroeconomic uncertainty and the prospect of a record 2025/26 corn crop has not made it easy for growers to capitalize on this upside.
A steady erosion to the 2024/25 beginning stocks figure took place through the beginning of harvest, while the more abrupt change was an upward revision to exports in the December Strength in old crop export sales can be attributed to a number of factors, including:
- Early concerns about the size of Brazil’s safrinha corn crop thanks to delayed soybean plantings
- A push to import corn before tariffs came into effect
- Drought in Mexico’s corn growing regions
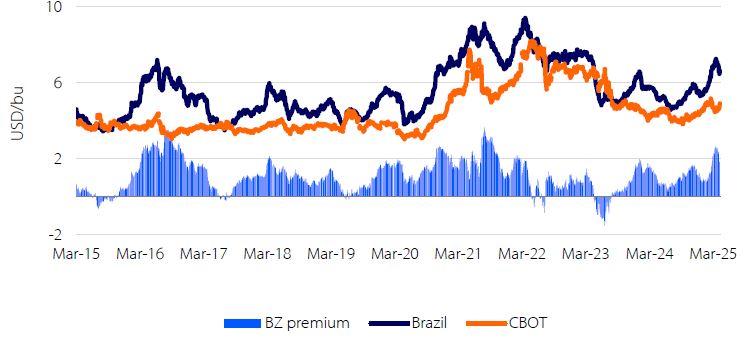
- The largest discounts on US corn relative to Brazil in four years.
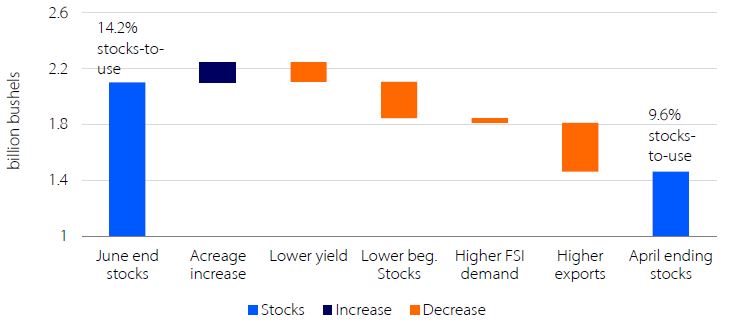
All told, these developments, coupled with modest changes to yield and FSI demand, have pushed projected 2024/25 ending stocks-to-use from 14.2% in June to 9.6% in April.
Tightening stocks slowly lifted corn futures over the course of the marketing year, reaching USD 19 in late February. While some farmers took action to lock in the highest prices in 22 months, on-farm stocks remained high in March, suggesting that many growers continued to hold out for something better.
The first shoe to drop in the 2025/26 crop came when the USDA released early estimates for increased corn acreage at its February Outlook Forum. The March planting projections report subsequently pinned this number at 95m acres, the largest since 2013.
US planting is underway and will build on South American production, which, despite inadequate moisture, promises to be a record. Despite more Brazilian corn being used for ethanol, South American exports are also expected to see a record thanks to recovery from
With greater supply come lower prices, and as such, the pace of new crop export sales has mirrored that of last year and is at its slowest since 2018. Like soybeans, corn stakeholders are pushing for increased biofuel usage domestically as a way of buffering against greater competition (and tariffs) in the export market. With gasoline consumption flat, the biofuel lobby has instead focused its efforts on allowing for year-round E15 sales. While the impact of higher blending rates could be substantial, there are logistical challenges to adoption since the share of gas stations with E15 infrastructure is less than 5% nationally, and far below that outside of the Midwest.
Change in 2024/25 corn crop fundamentals –
June 2024 to April 2025
Premium of Brazilian corn over CBOT
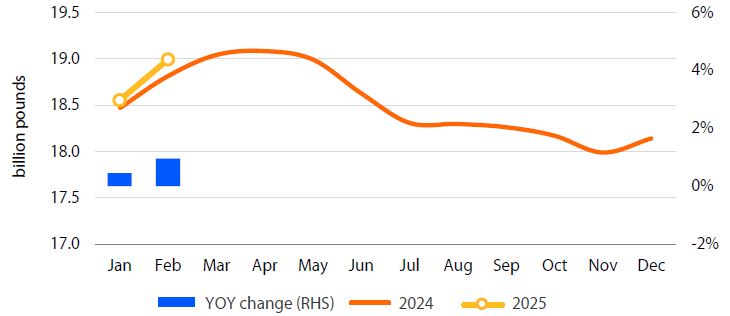
Dairy: Milk production returns to growth, but tariff risk persists
February milk production increased by 1% compared to the previous year on a leap-year adjusted basis, marking the largest year-over-year growth since February 2023. This strength was driven by a 0.3% year-over-year increase in milk per cow, coupled with an additional 62,000 cows in the herd compared to one year ago. In California, output fell by 3.7% year-over-year, marking the fifth consecutive decline, driven by avian influenza. Conversely, Idaho showed the largest increase of any state in February, up by 8.4% year-over-year. Production increased by 8% in Texas and 1.5% in New York, respectively, but decreased by 0.2% in Wisconsin.
The herd size has grown sharply in recent months, despite a limited supply of replacement animals. The January herd, originally reported at 9.365m head, was revised higher by 25,000 head to 9.39m. Cow numbers increased by an additional 15,000 head in February, resulting in a 40,000 cow increase on a report-to-report basis. At 9.405m head, the herd size is up by 62,000 animals compared to one year ago and is the highest of any month since May 2023.
While California continues to be negatively impacted by the residual effects of avian influenza, the state has reported only eight new cases between mid-March and mid-April. Thirty-one cases have been confirmed across all states over the past month, with Idaho recording the most at 21 cases.
Aside from avian influenza, RaboResearch maintains its 1% year-over-year milk production growth expectation for 2025. While farmer margins are estimated to be lower throughout the remainder of the year compared to the past six months, the outlook remains positive. As measured by the USDA’s Dairy Margin Coverage program, margins are estimated to average USD 12.05 per hundredweight in 2025, the highest of any year since the program began in 2019. While the March Class III price of USD 18.62 per hundredweight matched that of December 2024 as the lowest since May 2024, lower feed costs will support profitability.
Risk persists within the policy space. Consistently evolving implementation and constant changes around tariffs are creating uncertainty around dairy exports. To date, there has been minimal disruption for dairy products shipped to Mexico, the top destination for US products. However, rapidly escalating tariffs and subsequent retaliatory action from China are negatively impacting dry whey, permeate, lactose, and whey protein shipments, of which China is the top destination. Conversely, total February cheese exports grew by 4% year-over-year, setting a record high for the month, while butter exports jumped by 124% year-over-year.
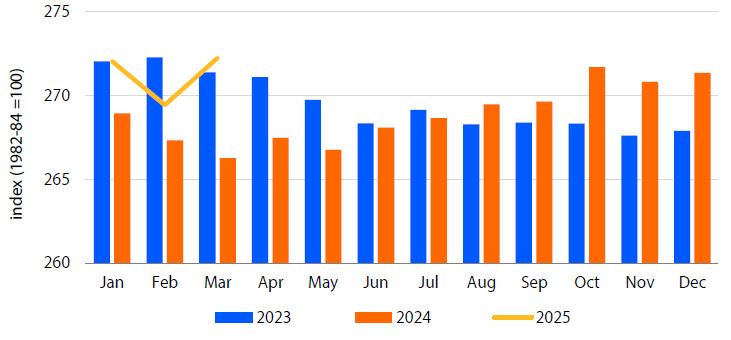
The dairy consumer price index increased by 2.2% in March, marking the eighth successive year-over-year increase and the strongest year-over-year gain since June 2023.
US milk production (30-day months), Jan 2024-Feb 2025
Consumer price index: dairy and related products, Jan 2023-Mar 2025
Farm inputs: Breadth of tariffs significant, even after rate reduction
With ‘Liberation Day’, a ‘bait and switch’ occurred. While the industry focussed on the potential impact of tariffs on Canada and Mexico, the breadth of tariffs placed on so many other geographies may have a greater impact on US farmer affordability. Then came the pullback, a reversion to a flat 10%. The assumption is that USMCA rules will continue to apply to fertilizer trade in North America.
Taking the 10% as the de facto reality today, the breadth of that 10% is nonetheless a significant factor. 10% applied across an array of phosphate suppliers such as Saudi Arabia, Tunisia, Jordan Egypt and Australia compounds the pricing pressure placed on the marginal ton supplied and could worsen affordability issues in the US market. This could in turn have a knock-on and marginally inflationary effect on Canada’s phosphate prices. While Morocco has in the main eschewed the US market after the imposition of countervailing duties (CVDs), the running assumption is that these 10% applied tariffs will be in addition to the current CVD rate of 16.6%
Beyond phosphates, the impact will be seen on the nitrogen complex, as well. The reduction in tariffs for certain countries will be of relative reprieve, but the 10% still in place for Middle Eastern, and African suppliers will have a notional impact on the pricing. Midwest terminal urea, as an example, took a ~5% step up in prices in the week after reciprocal tariffs were announced. While all macronutrient prices saw an upside price reaction on a week-over-week basis, it was urea and UAN that showed the most response
Despite the worst-case scenario of a 25% tariff on Canadian potash being avoided, 10% tariffs on residual supplies from Israel and Germany may be felt. That is, unless we see Russia stepping into the fold. Absent from tariffs were Russia. While Russia is largely capped out of the phosphate markets by CVDs, they do remain a significant supplier on potash and nitrogen products. Why they were exempted is open to speculation, but should they decide to take a more active role in supplying US markets, this could impact the domestic price dynamic. 10% tariffs across the board for competitors will be of obvious benefit to the Russians
Looking beyond fertilizers, some important exemptions were included in Annex II of the ‘Liberation Day’ tariffs. While certain intermediates for key active ingredients synthesis (like 2,4-D and dicamba) were exempted, several key active ingredients do appear to have been exempted too. This does not mean that the impact will not be felt, particularly if the tariffs on China persist into the 2026 season.
Regardless, these tariffs will be inflationary for growers. Where we had seen a scarcity premium hit phosphates in the US in previous years, we may see this impacting nitrogen products too, with domestic prices potentially trading at a premium to global benchmarks in the months ahead.
Mid-West UAN prices – trending higher and exposed to tariff price upside
US potash prices – showing cyclical upside price momentum
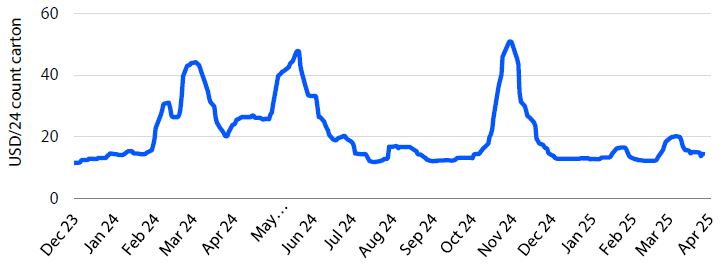
Fruits: Citrus prices are under pressure, while avocado prices continue to be strong for larger sizes
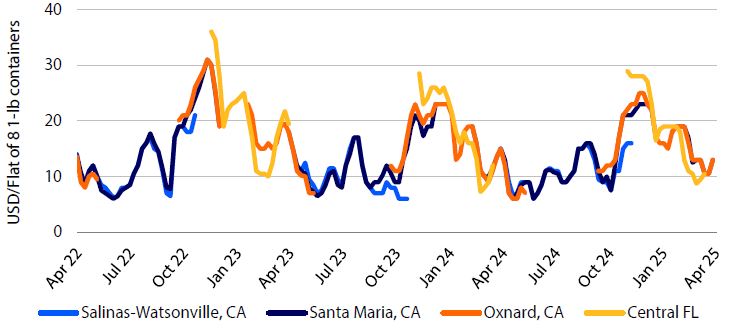
Strawberry shipping-point prices were around USD 13 per flat for non-organic fruit from California, down about 13% YOY by mid-April. Total arrivals in the US market over the past four weeks have been up about 16% YOY. Volumes have been steadier this year than in the previous season. Market conditions are considered favorable as California approaches its peak production of the year.
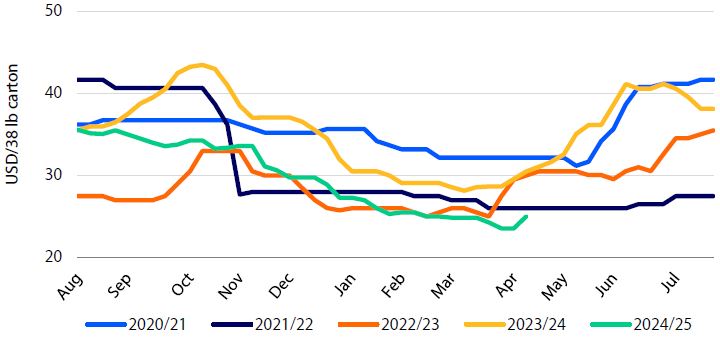
Lemon shipping-point prices for140s were at around USD 25 per carton by mid-April, a multi-year low, down 18% YOY and 13% below the five-year average for this time of the season. Signs of oversupply out of California continue to hit this citrus market. USDA forecasts 27m boxes of California lemons in 2024/25, up 10% YOY. Navel orange shipping-point prices for 88s were just over USD 16 per carton, down about 35% YOY and at a multi-year low for mid-April, per USDA figures. Larger sizes show YOY price increases, while medium to small sizes show relevant YOY declines as massive heatwaves in California impacted fruit development for the 2024/25 marketing year. A recent USDA production estimate has Valencia orange production in California at 7.5m boxes for this summer season, up 5% YOY.
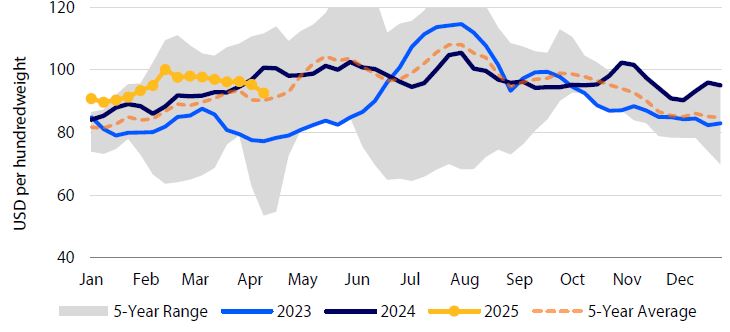
Hass avocado shipping-point prices, size 48s from California, were around USD 71 per carton during the second week in April, up 51% YOY and the highest price on record for this time of the year. The price gap across sizes continues to be unusually high, given low supplies of large-sized avocados in the US market. California will harvest the largest crop since 2020, partially compensating for the lower volumes expected from Mexico. Peru and Colombia will pay 10% tariff until further announcement, reducing the possibility of lower prices in the summer. Production in Mexico will recover in the 2025/26 marketing season.
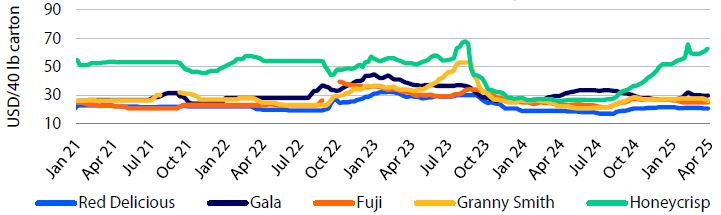
Fresh apple prices show YOY increases for selected varieties, with shipping-point prices for Honeycrisp, Granny Smith, Red Delicious, Fuji, and Gala up 142%, 17%, 8%, 4% and 1% YOY, respectively. US fresh apple inventories were 66.3m bushels in April 2025, down 3% YOY.
Washington apple shipping-point prices, 88s – WA Extra Fancy, 2020-2025
Strawberry shipping-point prices – primary US districts, 2022-2025
Fresh lemon shipping-point prices, non-organic, shipper’s 1st choice -140s-, 2020-2025
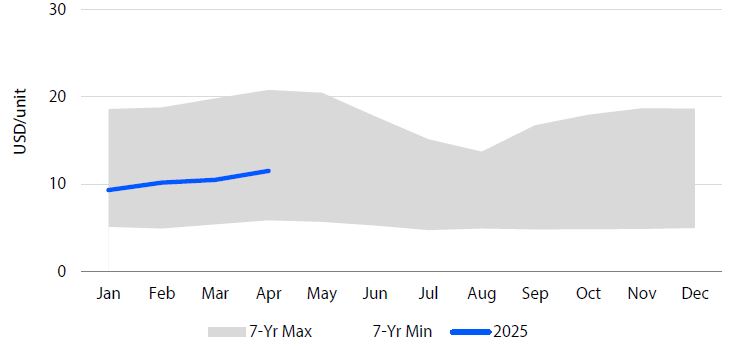
Pork: Trade disruption begins to weigh on pork values, producers remain cautious
The US sow herd remained relatively flat through Q1 2025, down 0.6% YOY at 6 million head. Farrowing intentions and pigs saved per litter numbers were also in-line with expectations. The largest surprise in the USDA’s March Hogs & Pigs report was the downward revision to the December market hog inventory of 940,000 or roughly -1.3%. The adjustment more accurately reflects market availability, ultimately limiting the market impact. Productivity gains continue to offset limited growth in the sow herd, with pigs saved in the quarter up 1.1% versus year-ago. Year-to-date production is flat versus the prior year, with a slight drop in slaughter offset by a gradual increase in weights. For the year, Rabobank is currently forecasting a 1% YOY increase in pork production driven by a modest gain in weights and slaughter. Limited availability of weaned pigs to start the year is likely to limit the pace of industry growth in the coming months, while export uncertainty also likely played a role.
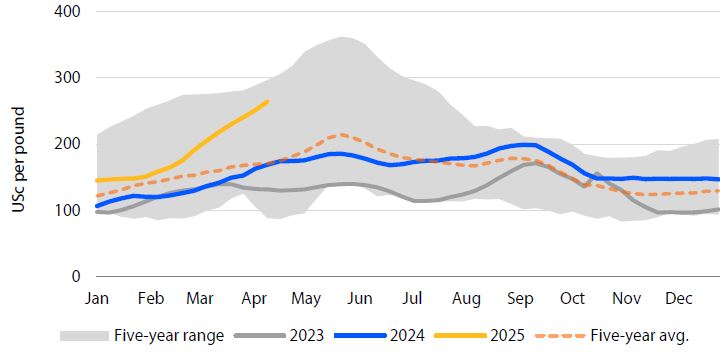
The US pork cutout fell below year-ago levels in early April, after averaging 6% ahead of last year through Q1 2025. The decline reflects weaker ham and loin values, and while down from their February highs, belly prices have held up better than expected and are flat with year- ago. The threat of tariffs and recent export disruption had both positive and negative impacts in the quarter, with tighter belly imports supporting higher prices. Potential trade disruption with Mexico had a negative impact on ham value, while variety meats and offal are only now seeing the impact of prohibitive tariffs on exports to China (the largest export market for this product). Pork inventories were -8% YOY in February, with a notable drop in bellies and loins partially offset by the double-digit increase in hams.
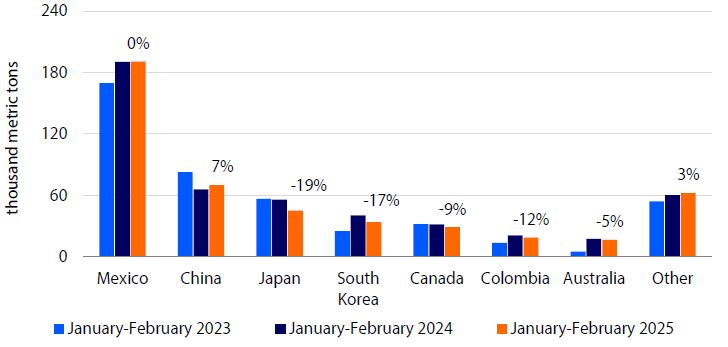
Year-to-date pork exports are down 3.5% YOY through February, at 466,000 metric tons, and down 1.8% YOY in value. In light of proposed tariffs and the potential for retaliatory actions, it is not surprising that shipments to China (+7% YOY) were stronger to start the year. Shipments to most other destinations were lower, however, as high US prices and lower cost alternatives weighed on trade. The double-digit decline in volumes to Japan (-19% YOY) and South Korea (-17%), along with weaker sales to Canada (9%) are not expected to stabilize in the near-term. While the near-term tariff situation remains fluid, we expect a majority of US pork exports to China to be uncompetitive at today’s 172% tariff rate. Much of these exports are offal items with few secondary markets and in total would represent roughly a billion dollars in lost value annually.
Mexico has seen a gradual improvement in the productivity of its swine herd. Although prices remain 18% above year-ago in April, they are down from the record MXN 53/kg posted in February. Stronger hog prices and lower supplies are putting some pressure on the packing sector, as the weaker consumer outlook and the shift in holiday timing have not allowed the market to fully absorb the added cost. An increase in pork imports of 10% YOY through the early part of the year is also putting additional pressure on the packing sector.
Pork cutout begins to weaken on potential trade risk, Jan 2023-Apr 2025
US pork exports off to a slow start in 2025
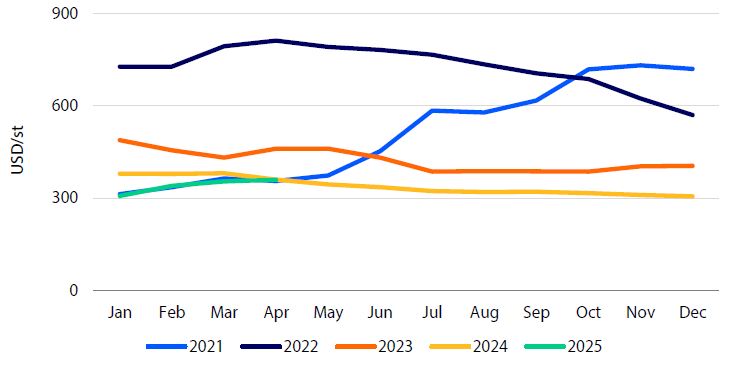
Poultry: Chicken markets strengthen into spring, even as production increases
US ready-to-cook (RTC) chicken production in Q1 2025 was 3.4% higher YOY, as the number of birds slaughtered rose 1.8% YOY and average weights were 1.6% higher. Industry efforts to offset ongoing productivity challenges by increasing weekly egg sets (and chick placements) were effective in the quarter but unlikely to continue at the current pace. Egg sets, which averaged 249m per week, or 2.9% more than the prior year, have dropped back to a gain of 1.8% versus the prior year. We expect industry slaughter to remain ahead of year-ago through 1H 2025, with more modest gains in 2H 2025. Weights are also likely to remain high in coming months as feed costs remain low on current market dynamics, which should provide a tailwind for the industry as this is the most significant cost of production. Based on our improved profitability projections and current production trends, RaboResearch projects a +1.2% YOY increase in chicken production in 2025.
Chicken prices remain above year-ago levels despite weaker foodservice trends and export uncertainty. Strength in the boneless breast meat market (up 56% YOY) continues to drive industry composite chicken values and improve profitability, with prices quickly approaching 2022 record highs. Inventory building ahead of planned foodservice promotions this summer are contributing to the price strength, with steady retail promotional activity also playing a role. Strong dark meat prices (leg quarter values up 9% YOY to near-record highs) are also helping boost composite values, with steady retail thigh meat demand increasing deboning activity. Chicken’s favorable health profile and affordability remain strong demand drivers, especially given the high cost of US ground beef supplies. While economic weakness and waning consumer sentiment is a concern, we expect breast meat prices to remain ahead of year-ago through 1H 2025. Leg quarter prices are also expected to remain strong given retail and foodservice support for dark meat as a value item, despite continued weakness in exports.
US chicken export volumes continued to languish to begin the year, down 13% YOY at 499,000 metric tons, as high US chicken values and a strong dollar continue to weigh on the market. While export volumes were lower to all but Cuba (up 11% YOY) and Canada (up 39% YOY) through February, the value of US chicken exports has increased in all top ten markets aside from China. China had already dropped in importance as an export destination for chicken, falling from 13% to 4% of export volumes as a result of highly pathogenic avian influenza-related trade barriers over the past two years. This decline will limit the impact of lost export sales given current trade impediments. We are currently projecting a 6% decline in US export sales in 2025.
After starting the year strong, Mexican chicken prices dropped below year-ago levels in mid-March. Live chicken prices are currently MXN 33.97/kg, 18.1% below the previous year and below the five-year average on improved supply. Retail prices are also lower (down 15% YOY) although seasonal demand was stronger in April. Low-cost imports from the US and Brazil continue to weigh on the market, despite threatened tariff disruption with the US.
Weekly boneless, skinless chicken breast prices move higher seasonally, Jan 2023-Apr 2025
Leg quarter prices approaching record highs, 2014-2025
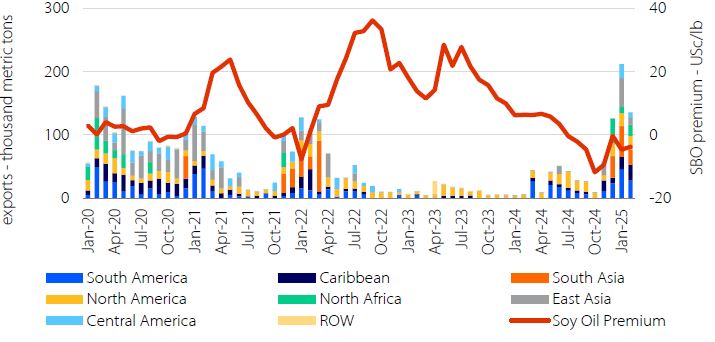
Soy & oilseed complex:SBO exports throw the complex a temporary lifeline
US soybean markets continue to struggle finding their footing in the face of stagnating biofuel policies. While prices have recovered somewhat from their August lows, the rebound (8%) has been far more muted than that of corn (32%). The imbalance has pushed soy/corn ratios to their lowest levels since 2013 and will drag 2025/26 soybean acres down with it. The USDA’s projected plantings report, released in late March, points to a soybean planted area of 83.5m acres in the year ahead, which, if realized, would be the lowest level since 2020.
Soybeans are once again poised to be the tip of the spear in China’s retaliatory response to US tariffs. While prices vacillate on daily developments in rhetoric on both sides, swings have been more muted than under the first trade war. The reason for this is threefold:
- As president Trump made headway in the 2024 election, soybean markets began pricing in trade war impacts in advance
- The US lost market share in China to Brazil, seemingly permanently, in the wake of the last trade war, making China less singularly important to the US soybean market
- While the US has diversified its export portfolio somewhat, the bigger factor has been the growth in domestic crush, to feed renewable diesel demand
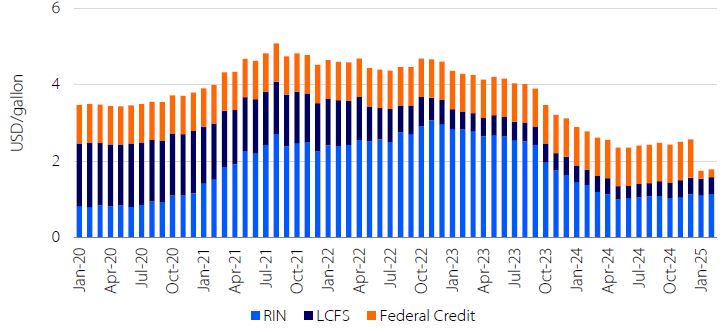
After explosive growth post-Covid, US biofuel demand has plateaued largely due to an indifferent policy environment. The cumulative value of renewable diesel RINs and and LCFS credits is just USD 1.60/gallon today compared with the peak north of USD 4 achieved in August of 2021. While these values fell steadily over the course of 2023 in the face of oversupply, the transition from a USD 1/gal blenders credit to a ~USc 20 producers’ credit occurred abruptly in the new year, forcing a substantial idling of biodiesel capacity.
Fortunately for the sector, temporary bullishness in the palm oil sector opened up a window early in the year for record SBO exports, with flows concentrated to South Asia.
As palm has come back down to earth, that arbitrage opportunity has subsided and the US soybean sector once again finds itself looking to biofuel policy for answers. The EPA is obligated to provide a draft volume obligation for 2026 six months in advance meaning stakeholders should get more clarity about the outlook for biofuels by July.
Renewable diesel credit stack
SBO premium to palm oil and US exports by region
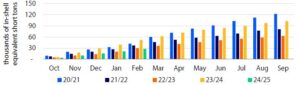
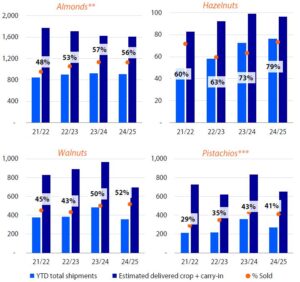
Tree nuts: Short-term market fundamentals continue to support prices
Almonds: Shipments through March for the 2024/25 marketing season were down 1.6% YOY, with domestic shipments down 3.5% YOY and exports down 0.9% YOY. Computed inventories to date are down 0.8% YOY, increasing the probability of a bullish carry-out. Prices have shown strength, continuing to reach new multi-year highs given short-term market fundamentals. Early estimates put the 2025/26 crop at around 2.8bn pounds, slightly larger than the previous crop. Longer-term effects of retaliatory tariffs remain to be seen, as the industry has diversified export destinations.
Hazelnuts: Shipments in 2024/25 through March were up 5% YOY, with kernel exports increasing 41% YOY. Over the past few seasons, the volume of in-shell exports has been declining, as the industry favors increasing volumes of higher-value kernel exports. Shipments are tracking well, with 79% of volume sold.
Walnuts: Production in California in 2024 was down about 28% YOY to its lowest level in 10 years.
Reduction in acreage, natural alternate-bearing, and heterogeneous yields were the drivers. Shipments for the 2024/25 marketing year were down about 26% YOY through February, with exports down 25% YOY and domestic shipments down 28% YOY, per industry figures. Prices have relatively stabilized at multi-year highs since December. Global market fundamentals will likely support prices for the rest of the marketing year.
Pistachios: Shipments through February were down 25% YOY, with domestic shipments down 5% and exports down 30% out of an ‘off-year’ crop in 2024/25. Shipments are on track to end the season with manageable inventories, which has supported prices. 2025/26 was expected to be an ‘on-year’ in California, but pollination season presented some challenges that will be evaluated when looking at yields during harvest in the fall.
Pecans: US pecan export volumes in the 2024/25 marketing season through February were down 46% YOY from a multi-year high in the corresponding period of 2023/24, according to USDA figures. US pecans received by handlers were considerably down YOY, as hurricanes impacted production in the south, according to The American Pecan Council.
Cumulative US pecan exports by marketing year
Source: USDA FAS, RaboResearch 2025
Cumulative US tree nut shipments by marketing year*
(thousands of in-shell equivalent short tons)
Vegetables: A smooth transition of the season for leafy greens provides insights of reliable supplies this spring
Fresh vegetable sales at retail increased 6% YOY in value and 5% YOY in volume during February 2025, according to IFPA. Specific product categories that reported YOY increases in value and volume at retail include potatoes, cucumbers, carrots, and broccoli.
Potatoes: The North American Potato Market News (NAPMN) projects that US growers will plant 39,000 fewer acres of potatoes in 2025 compared to 2024. This decrease is primarily due to reductions in contract volumes for frozen processing potatoes. The largest reductions are expected in Idaho, Washington, Oregon, and Maine, with potential decreases also in Michigan, Minnesota, and Wisconsin. However, the potato acreage in six reporting states is expected to remain relatively unchanged. The projected planted area for 2025 is 891,000 acres, which is a 4.2% decrease from the 2024 crop and 4.8% below the five-year average. Despite this reduction, the acreage combined with the trend-line yield of 463 cwt per acre would produce approximately 410m cwt of potatoes, only 2.1% smaller than the five-year average US potato crop.
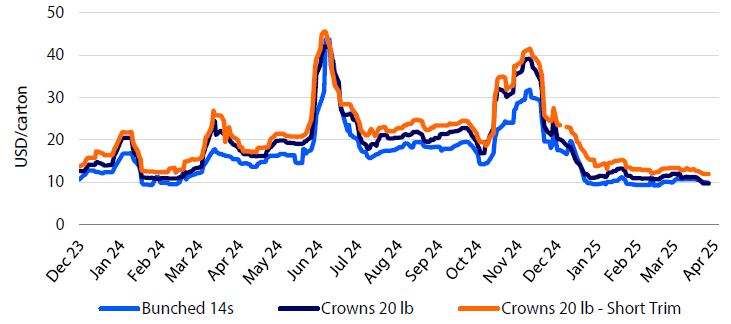
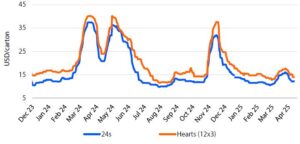
Leafy greens and brassica: At about USD 12 and USD 14, romaine 24s and hearts (12×3) were down 41% and 42% YOY, respectively, by mid-April. The sector has successfully transitioned from Western Arizona and Imperial Valley to Salinas/Watsonville and Santa Maria without supply gaps or relevant price shocks. At about USD 14.5, the price for a carton of iceberg wrapped 24s was down 28% with respect to the year-ago price after the second week of April 2025. There is an overlap between production from Western Arizona and San Joaquin Valley, while production is ramping up in Salinas-Watsonville and Santa Maria, providing a smooth transition of the season. At about USD 10 per 20-pound carton, the broccoli crown price was down 49% YOY by mid-April, while prices for short-trim crowns were at USD 12, down 42% YOY during the same period.
Wrapped iceberg lettuce
US daily shipping-point price, 2023-2025
Broccoli
US daily shipping-point price, 2023-2025
Romaine lettuce
US daily shipping-point price, 2023-2025
Wheat: A “yes, but” market
Global wheat markets continue to flash price-friendly signals. However, wheat prices for North American farmers remain stuck in a broad trading range established back in June 2024. The wheat market is a “yes, but” market.
Yes, the global wheat market continues to show friendly price signals. Total global wheat stocks and stocks among exporters remain in a multi-year decline. There are several major growing areas still battling weather issues, e.g. Russia and Ukraine remain dry, France is extremely wet, while Germany is dry and the US Great Plains are still suffering under drought conditions. Finally, the threat of a Russian export embargo or increased export taxes has resulted in buyers looking to other origins to ensure supply.
On the bearish side of global fundamentals, Argentina’s export tax pause until June 30 has made Argentine’s wheat competitive on the world market, thereby adding to supply. The market’s perception is that an end to the war in Ukraine would be bearish for prices. Keep in mind, both Russia and Ukraine have been shipping wheat and other commodities on par with the pace prior to the beginning of the war. Should the war end, it would be psychologically bearish to the market in the short term, but it is likely prices will bounce back quickly as the market realizes Russia and Ukraine have been shipping all along.
In North America, wheat prices have been under pressure from good crops in both Canada and the US in 2024. Both countries are projected to increase planted wheat acres in 2025. This will result in an increase in stocks. In addition, the bearish corn market has weighed on wheat prices. And with large US planted corn acreage in 2025, the potential is there for the corn market to put further downward pressure on wheat prices.
The “tariff war” has had different impacts on US and Canadian wheat markets. As of this writing, the trade war has escalated between the US and China which has the potential to seriously damage US commodity exports. While China is not a big customer of US wheat, the on-again off-again tariffs have made buyers think twice before buying from the US. Canada has the potential to be one of the winners in the ‘tariffs wars” as buyers eschew the US. However, there are two cautions for Canada. One, the US is large buyer of Canadian durum wheat. Two, as allies, Canada may get painted with same tariff brush as the US, e.g. Chinese tariffs on canola oil and meal.
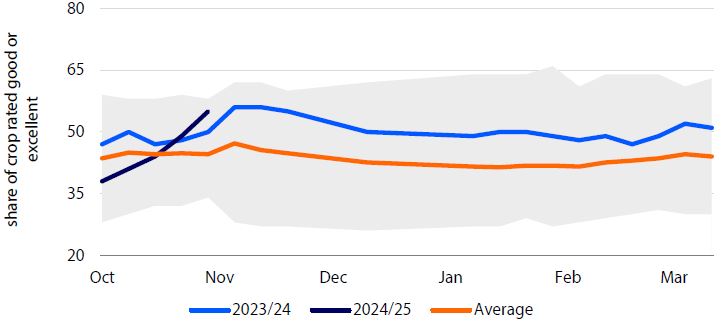
While a large corn crop can be depressive to wheat prices, so can a large US winter wheat crop. US winter wheat conditions remain 47% good to excellent as the crop is coming out of dormancy. This compares to 56% last year and going into dormancy last fall the crop was rated 56% good-to-excellent. While the crop rating is below the last three years’ ratings and last fall’s, it is a long way to harvest.
US winter wheat crop rating – down from
last fall
US and global wheat stocks moving in
opposite directions
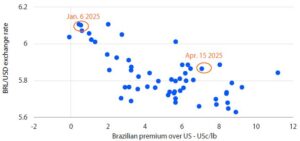
Cotton: Cheaper dollar and decreased production point to higher prices for 2025/26 crop
As the most export-oriented of all the major US row-crop commodities, cotton prices, predictably, have not held up well to spasmatic tariff conversations. On March 4th, the day the Trump administration announced tariffs, nearby prices fell to USc 59/lb – a level not seen since the heights of the Covid pandemic.
While structural challenges remain, namely cotton’s displacement by synthetic fibers, and growing competition overseas, there is a growing case to be made for a modest recovery in prices as the market shifts its attention from old crop to new.
Low prices are leading growers to cut back on acreage. Industry surveys, for example, point to 2025/26 upland cotton area of 9.4m acres – the lowest since 2015/16 if it comes to pass. Dry weather in west Texas may dissuade growers from planting corn and ultimately increase this figure but would also limit yields in the process. While Brazilian cotton expansion will be hard to slow down, other major producers like China, Turkey, India, Australia and West Africa are all projected to join the US in reducing acreage.
Tariff rhetoric will be a double-edged sword for the US cotton industry in the year ahead. On the one hand, it could hamper global growth in what was otherwise expected to be a positive year for cotton demand. On the other hand, the sell-off in US treasuries and the drop in the dollar, is making US cotton more competitive from an export standpoint.
US dollar index and relative competitiveness of US to Brazilian cotton
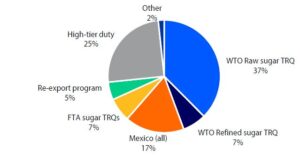
Sweetener: Increasing supply
In the 2024/25 cycle, US sugar beet production is projected to reach a record high of 5.3m short tons raw value (STRV), while sugarcane production is expected to decline, primarily due to challenges in Florida. For the 2025/26 cycle, US beet producers are likely to expand their planted area by approximately 2.5% compared to the current year.
During the ongoing cycle 2024/25, the USDA anticipates US sugar imports of around 3m short tons (STRV). Most of these imports will fall under the tariff rate quota (TRQ) program, followed by the high-tier tariff program and then by imports from Mexico. For the 2024/25 cycle, Mexico is expected to export approximately 500,000 short tons (STRV) of sugar to the US.
Currently, Mexican sugar exports to the US will continue under the existing suspension agreement and are not subject to the new retaliatory tariffs imposed by the US government on other countries. If the current trade environment holds, there is potential for an increase in Mexican sugar exports to the US.
In 2024/25, Mexico may contribute only 17% of US sugar imports
Report Authors
Philip Marey
Senior US Strategist
Global Economics and Markets
Global Head
Jan Lambregts
+44 20 7664 9669
Jan.Lambregts@Rabobank.com
Macro Strategy
Global
Michael Every
Senior Macro Strategist
Michael.Every@Rabobank.com
Europe
Elwin de Groot
Head Macro Strategy Eurozone, ECB
+31 30 712 1322
Elwin.de.Groot@Rabobank.com
Bas van Geffen
Senior Macro Strategist ECB, Eurozone
+31 30 712 1046
Bas.van.Geffen@Rabobank.com
Stefan Koopman
Senior Macro Strategist UK, Eurozone
+31 30 712 1328
Stefan.Koopman@Rabobank.com
Maartje Wijffelaars
Senior Economist Italy, Spain, Eurozone
+31 88 721 8329
Maartje.Wijffelaars@Rabobank.nl
Americas
Philip Marey
Senior Macro Strategist
United States, Fed
+31 30 712 1437
Philip.Marey@Rabobank.com
Christian Lawrence
Head of Cross-Asset Strategy
Canada, Mexico
+1 212 808 6923
Christian.Lawrence@Rabobank.com
Mauricio Une
Senior Macro Strategist
Brazil, Chile, Peru
+55 11 5503 7347
Mauricio.Une@Rabobank.com
Renan Alves
Macro Strategist Brazil
+55 11 5503 7288
Renan.Alves@Rabobank.com
Molly Schwartz
Cross-Asset Strategist
+1 516 640 7372
Molly.Schwartz@Rabobank.com
Asia, Australia & New Zealand
Teeuwe Mevissen
Senior Macro Strategist China
+31 30 712 1509
Teeuwe.Mevissen@Rabobank.com
Benjamin Picton
Senior Macro Strategist Australia, New Zealand
+61 2 8115 3123
Benjamin.Picton@Rabobank.com
FX Strategy
Jane Foley
Head FX Strategy G10 FX
+44 20 7809 4776
Jane.Foley@Rabobank.com
Rates Strategy
Richard McGuire
Head Rates Strategy
+44 20 7664 9730
Richard.McGuire@Rabobank.com
Lyn Graham-Taylor
Senior Rates Strategist
+44 20 7664 9732
Lyn.Graham-Taylor@Rabobank.com
Credit Strategy & Regulation
Matt Cairns
Head Credit Strategy & Regulation
Covered Bonds, SSAs
+44 20 7664 9502
Matt.Cairns@Rabobank.com
Bas van Zanden
Senior Analyst Pension funds, Regulation
+31 30 712 1869
Bas.van.Zanden@Rabobank.com
Cas Bonsema
Senior Analyst Financials
+31 6 127 66 642
Cas.Bonsema@Rabobank.com
Maartje Schriever
Analyst ABS
+31 6 251 43 873
Maartje.Schriever@Rabobank.com
Agri Commodity Markets
Carlos Mera
Head of ACMR
+44 20 7664 9512
Carlos.Mera@Rabobank.com
Charles Hart
Senior Commodity Analyst
+44 20 7809 4245
Charles.Hart@Rabobank.com
Oran van Dort
Commodity Analyst
+31 6 423 80 964
Oran.van.Dort@Rabobank.com
Andrick Payen
RaboResearch Analyst
+1 212 808 6808
Andrick.Payen@Rabobank.com
Energy Markets
Joe DeLaura
Senior Energy Strategist
+1 212 916 7874
Joe.DeLaura@Rabobank.com
Florence Schmit
Energy Strategist
+44 20 7809 3832
Florence.Schmit@Rabobank.com
Disclaimer
Non Independent Research
This document is issued by Coöperatieve Rabobank U.A. incorporated in the Netherlands, trading as “Rabobank” (“Rabobank”) a cooperative with excluded liability. The liability of its members is limited. Authorised by De Nederlandsche Bank in the Netherlands and regulated by the Authoriteit Financiële Markten. Rabobank London Branch (RL) is authorised by De Nederlandsche Bank, the Netherlands and the Prudential Regulation Authority, and subject to regulation by the Financial Conduct Authority and limited regulation by the Prudential Regulation Authority. Further details are available on request. RL is registered in England and Wales under Company no. FC 11780 and under Branch No. BR002630. This document is directed exclusively to Eligible Counterparties and Professional Clients. It is not directed at Retail Clients.
This document does not purport to be impartial research and has not been prepared in accordance with legal requirements designed to promote the independence of Investment Research and is not subject to any prohibition on dealing ahead of the dissemination of Investment Research. This document does NOT purport to be an impartial assessment of the value or prospects of its subject matter and it must not be relied upon by any recipient as an impartial assessment of the value or prospects of its subject matter. No reliance may be placed by a recipient on any representations or statements made outside this document (oral or written) by any person which state or imply (or may be reasonably viewed as stating or implying) any such impartiality.
This document is for information purposes only and is not, and should not be construed as, an offer or a commitment by RL or any of its affiliates to enter into a transaction. This document does not constitute investment advice and nor is any information provided intended to offer sufficient information such that is should be relied upon for the purposes of making a decision in relation to whether to acquire any financial products. The information and opinions contained in this document have been compiled or arrived at from sources believed to be reliable, but no representation or warranty, express or implied, is made as to their accuracy, completeness or correctness.
The information contained in this document is not to be relied upon by the recipient as authoritative or taken in substitution for the exercise of judgement by any recipient. Any opinions, forecasts or estimates herein constitute a judgement of RL as at the date of this document, and there can be no assurance that future results or events will be consistent with any such opinions, forecasts or estimates. All opinions expressed in this document are subject to change without notice.
To the extent permitted by law, neither RL, nor other legal entities in the group to which it belongs accept any liability whatsoever for any direct or consequential loss howsoever arising from any use of this document or its contents or otherwise arising in connection therewith.
Insofar as permitted by applicable laws and regulations, RL or other legal entities in the group to which it belongs, their directors, officers and/or employees may have had or have a long or short position or act as a market maker and may have traded or acted as principal in the securities described within this document (or related investments) or may otherwise have conflicting interests. This may include hedging transactions carried out by RL or other legal entities in the group, and such hedging transactions may affect the value and/or liquidity of the securities described in this document. Further it may have or have had a relationship with or may provide or have provided corporate finance or other services to companies whose securities (or related investments) are described in this document.
Further, internal and external publications may have been issued prior to this publication where strategies may conflict according to market conditions at the time of each publication.
This document may not be reproduced, distributed or published, in whole or in part, for any purpose, except with the prior written consent of RL. By accepting this document you agree to be bound by the foregoing restrictions. The distribution of this document in other jurisdictions may be restricted by law and recipients of this document should inform themselves about, and observe any such restrictions.
A summary of the methodology can be found on our website
© Rabobank London, Thames Court, One Queenhithe, London EC4V 3RL +44(0) 207 809 3000